Understanding line plots Grade 2 Worksheets
9 filtered results
-
From - To
Discover our comprehensive "Understanding Line Plots Grade 2 Worksheets," designed to enhance your child's mathematical skills in a fun and engaging way! These worksheets focus on teaching second graders how to read, create, and interpret line plots, vital components of data representation. With clear instructions and colorful visuals, students will grasp concepts like measurement and data analysis. Tailored to align with educational standards, our resources provide meaningful practice opportunities to foster confidence in math. Perfect for classroom use or at-home learning, these worksheets invite exploration and mastery of line plots, setting a strong foundation for future mathematical endeavors!

What Is a Line Plot? Worksheet

Students Line Plot Worksheet
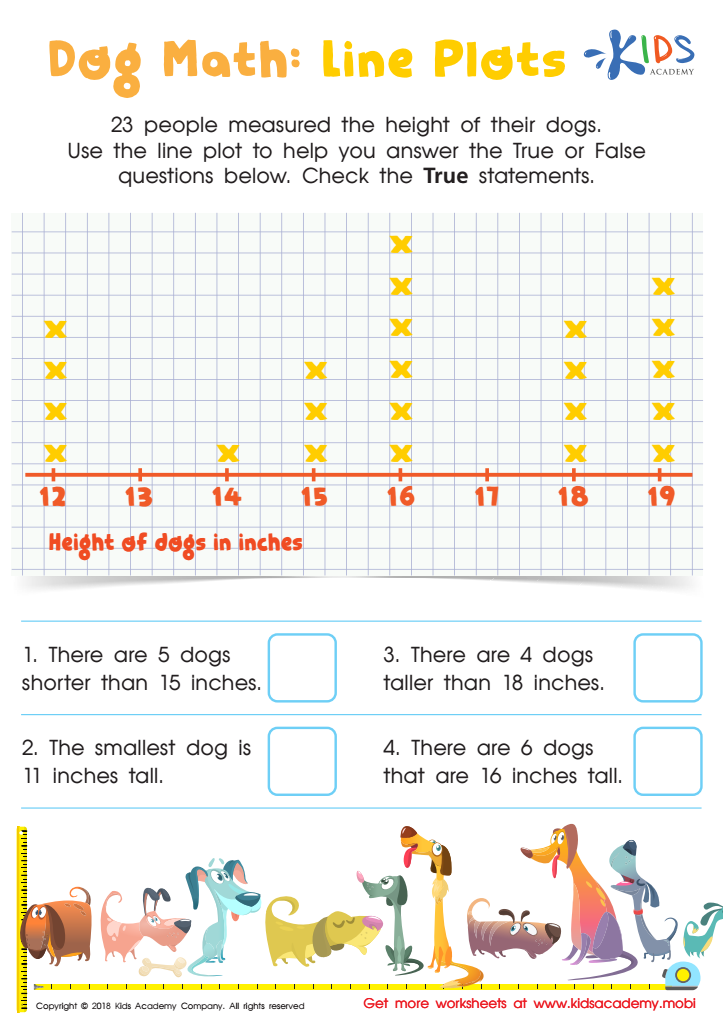
Dog Math: Line Plots Worksheet

Pencil Case Line Plot Worksheet

Line Plot Worksheet
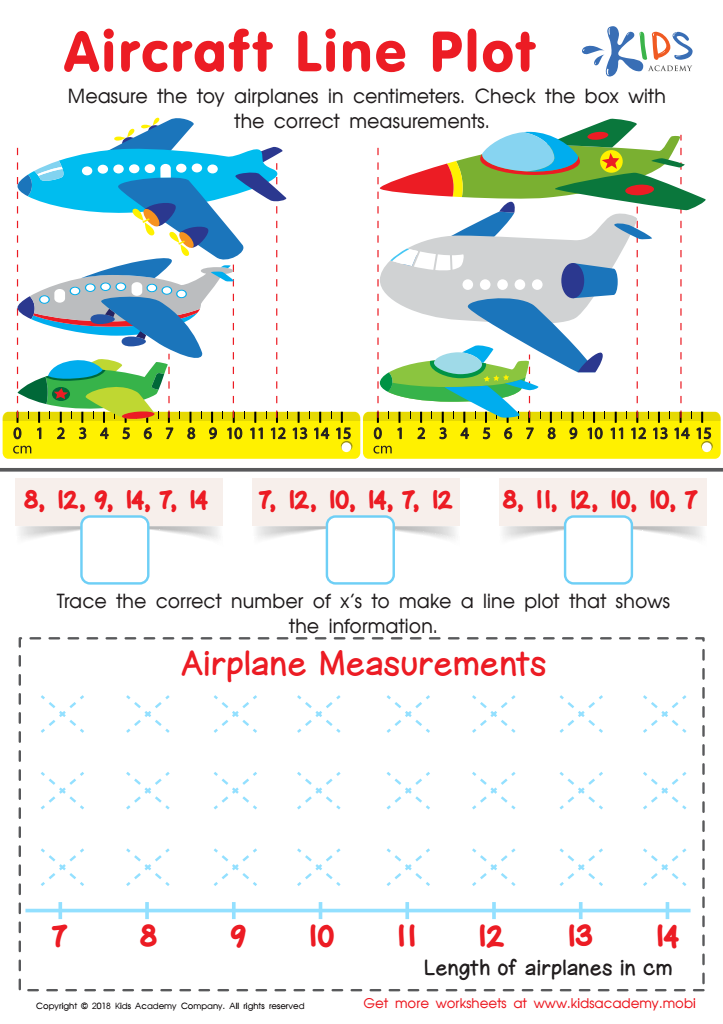
Aircraft Line Plot Worksheet

Family Line Plot Worksheet
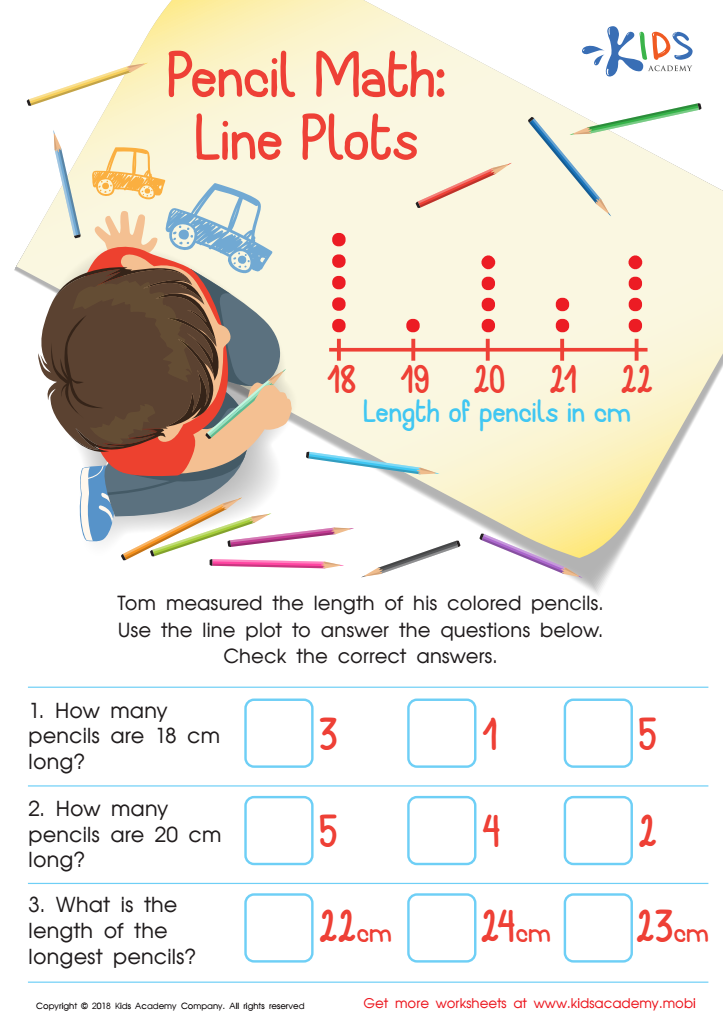
Pencil Math: Line Plots Worksheet
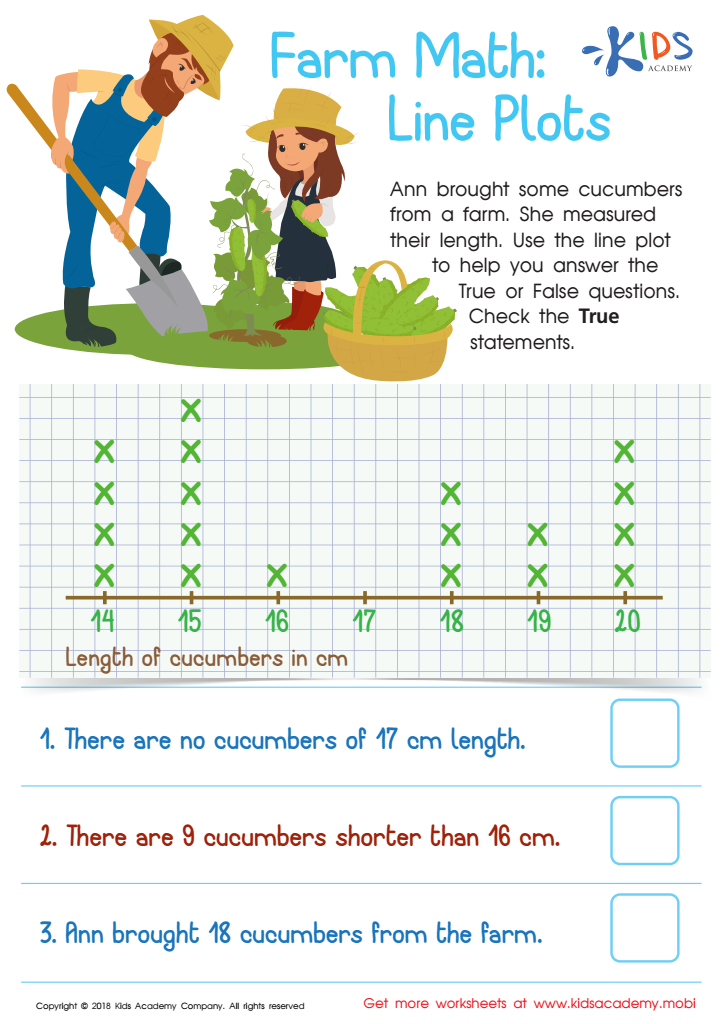
Farm Math: Line Plots Worksheet


Understanding line plots is an essential skill for Grade 2 students that parents and teachers should prioritize. Line plots are a visual way to represent data along a number line. Learning to interpret and create line plots aids students in developing critical thinking and analytical abilities.
By engaging with line plots, children enhance their mathematical thinking and reasoning. They practice collecting, organizing, and interpreting data, which are foundational skills in mathematics. This also helps students establish connections between numerical values and real-world situations, such as tracking daily temperatures or the number of pets among their classmates.
Additionally, line plots foster communication skills. Children learn how to share findings and explain their reasoning, promoting collaboration and discussion in the classroom. This encourages students to express their understanding and enhances their ability to consider different perspectives.
Moreover, developing data literacy at a young age prepares students for future mathematical concepts, building confidence in their abilities. By supporting their children’s learning in this area, parents can encourage a positive attitude towards mathematics and promote ongoing engagement with the subject in school and beyond. Ultimately, understanding line plots helps students navigate and make sense of the world around them.