Graph interpretation Worksheets for Ages 5-9
5 filtered results
-
From - To
Introduce young learners to the fascinating world of data with our "Graph Interpretation Worksheets for Ages 5-9". Designed to develop critical thinking and analytical skills, these worksheets cover bar graphs, pie charts, line plots, and more. Each activity features vibrant, engaging graphics, transforming abstract concepts into graspable, enjoyable tasks. perfect for both classroom or home learning, these resources support kids in interpreting and analyzing data effectively, setting a solid foundation for future STEM learning. Encourage your child to build confidence in reading graphs while having fun. Explore our worksheet collection to empower young minds with essential graphing skills today!

Taxi Math Worksheet
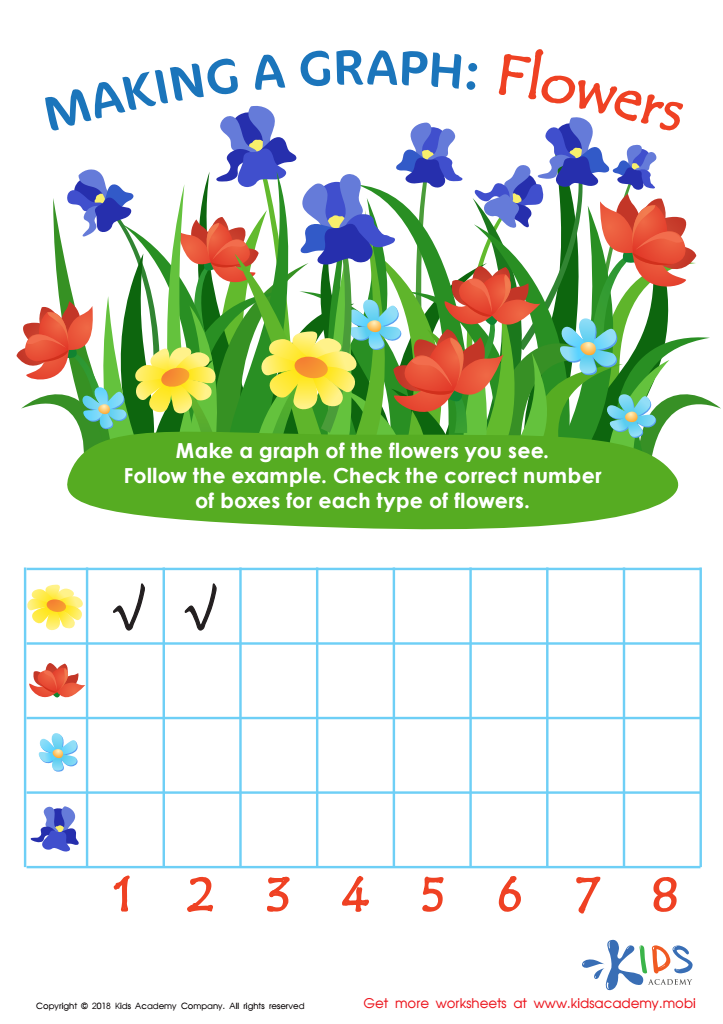
Making a Graph: Flowers Worksheet

Graph: Baby Animals Worksheet
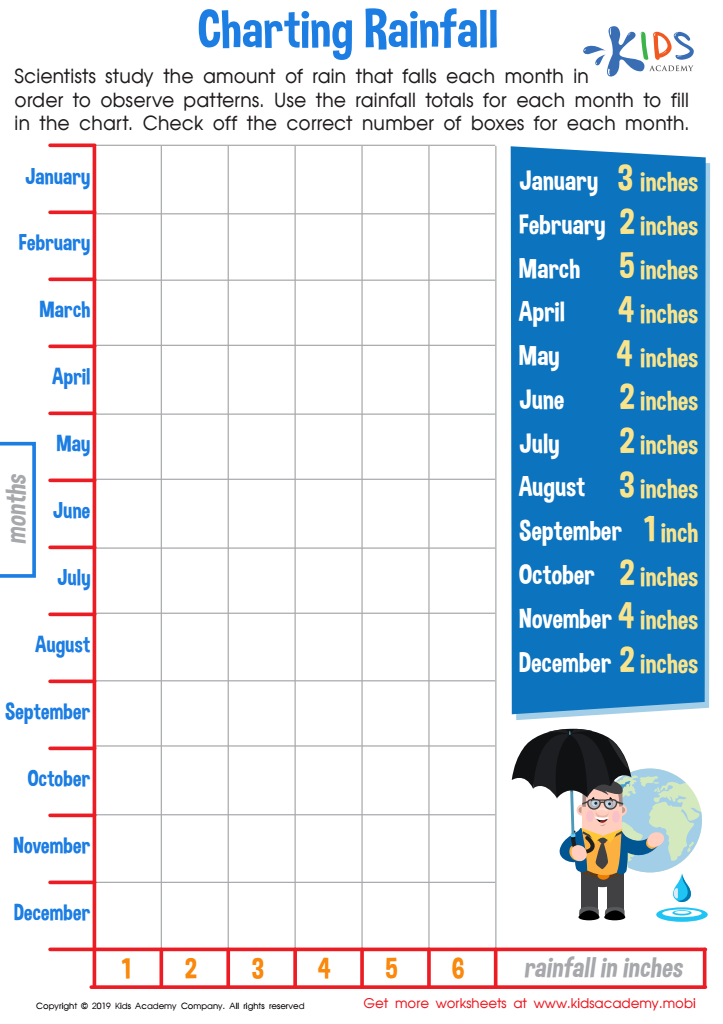
Charting Rainfall Worksheet
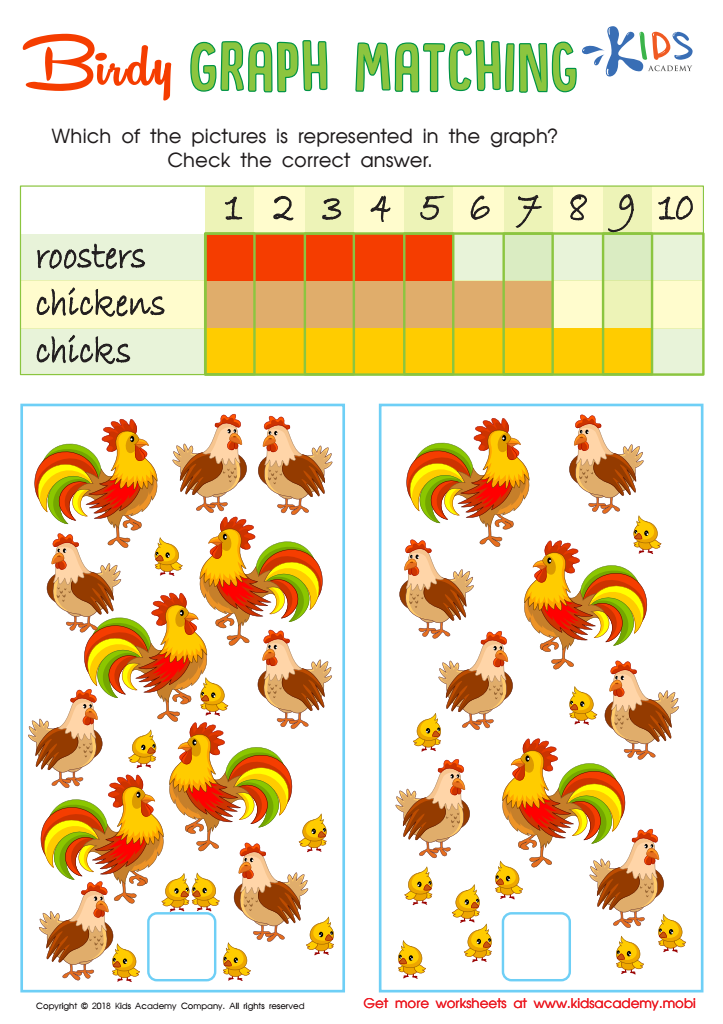
Birdy Graph Matching Worksheet


Graph interpretation is a crucial skill for young learners aged 5-9 because it lays a strong foundation for future mathematical and analytical thinking. Introducing this skill early fosters their ability to understand and make sense of information visually, which is vital in a data-driven world.
First, learning to interpret graphs helps children develop critical thinking skills. They learn to ask questions, identify patterns, and make comparisons. This analytical mindset is essential not just for mathematics, but for all subjects, including science and social studies.
Second, graph interpretation supports improved literacy and numeracy. Reading graphs requires understanding labels, titles, and scales, thereby enhancing reading skills while also reinforcing numerical concepts like counting, addition, and subtraction. These fundamentals are part of the national curriculum standards, and early exposure ensures that children build competency naturally over time.
Furthermore, understanding graphs boosts problem-solving skills. Children learn to collect data, represent it visually, and draw meaningful conclusions. This process encourages logical thinking and decision-making.
Finally, graphs make abstract concepts tangible. With vibrant visuals, children can see the actual impact of numbers in real-world contexts, making learning more engaging and relevant.
In sum, graph interpretation equips young learners with essential skills that are critical for academic success and day-to-day decision making in the information age.


