Graph reading skills Worksheets for Ages 6-7
3 filtered results
-
From - To
Enhance your child's graph reading skills with our engaging worksheets designed specifically for ages 6-7. These printable resources help young learners understand data representation through fun activities that incorporate charts, graphs, and pictograms. Each worksheet encourages critical thinking and boosts comprehension, allowing children to interpret information visually. With a variety of exercises that cater to different learning styles, your kids will build a strong foundation in mathematics and data analysis. Perfect for classroom use or at-home learning, our graph reading skills worksheets make learning enjoyable and interactive. Start your child’s educational journey today with these colorful and captivating worksheets!
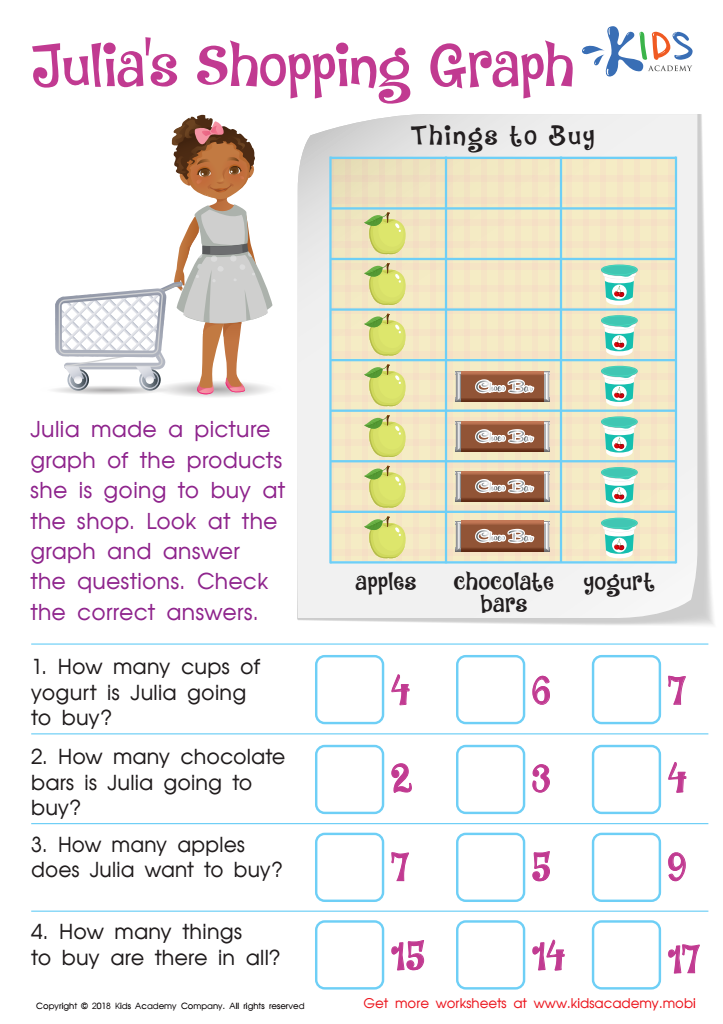
Julia's Shopping Graph Worksheet
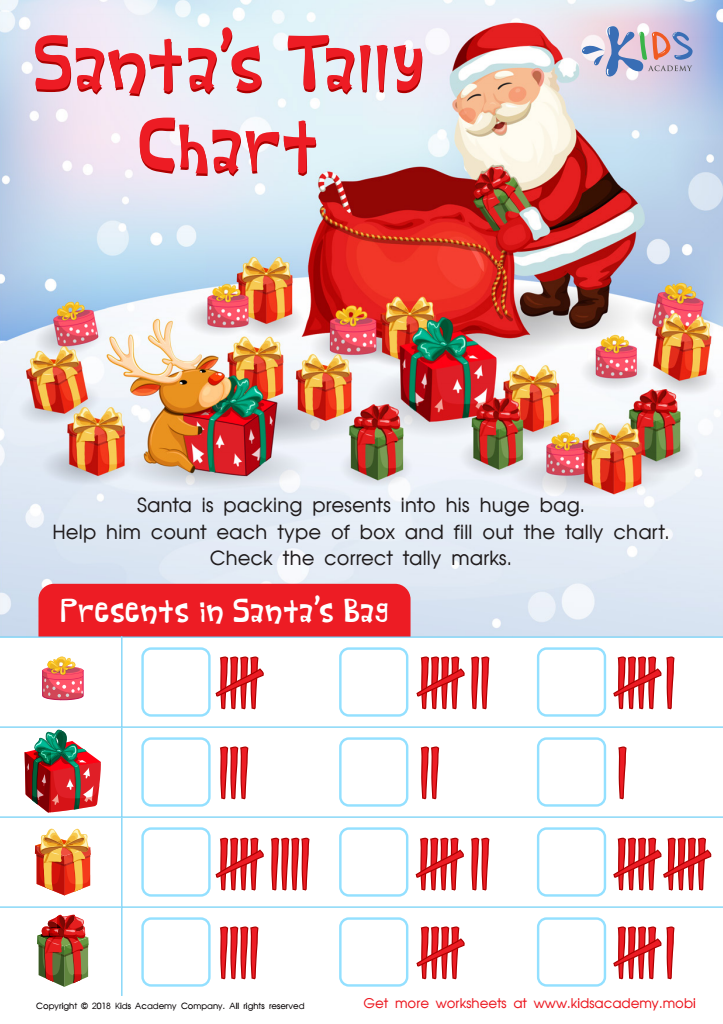
Santa Tally Chart Worksheet
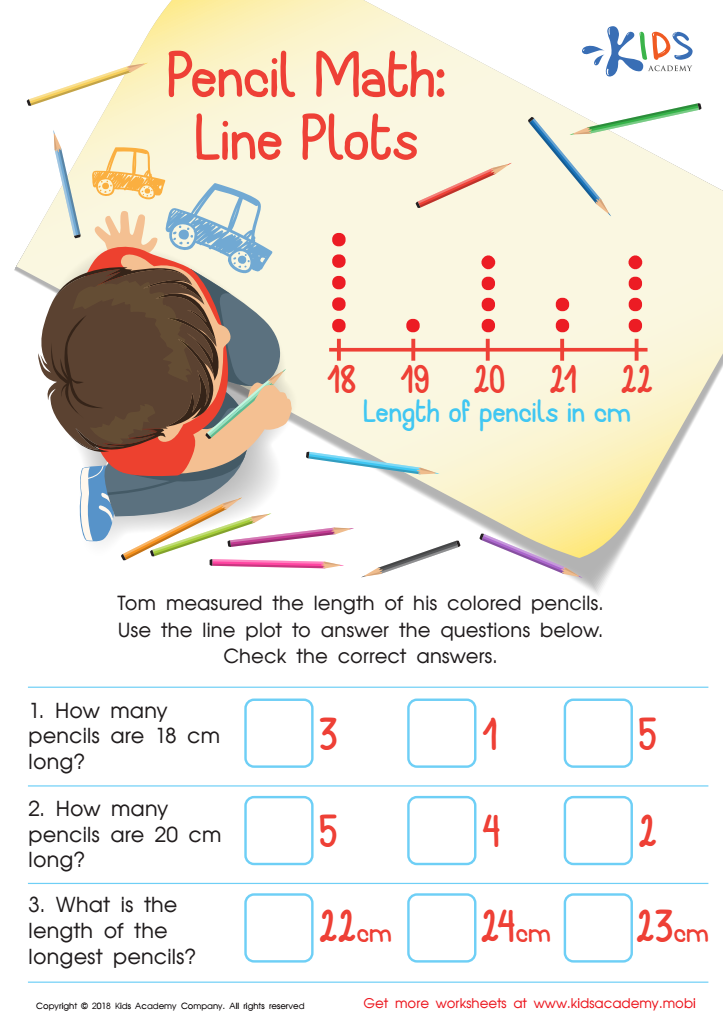
Pencil Math: Line Plots Worksheet


Graph reading skills are crucial for children ages 6-7 as they lay the foundation for critical thinking and data interpretation. At this stage, children are developing cognitive abilities that establish how they interact with information. Learning to read graphs helps them to understand and analyze data visually, an essential skill in today’s data-driven world.
Graphs simplify complex information, making it accessible for young learners. By interpreting bar graphs, pie charts, or line graphs, children can compare quantities, recognize trends, and draw conclusions, which enhances their analytical and problem-solving skills. This visual literacy broadens their understanding of diverse subjects, including math, science, and even social studies, fostering a well-rounded education.
Moreover, graph reading cultivates curiosity and encourages hands-on learning experiences. Teachers and parents can engage children in activities that involve collecting data—like a class weather chart or a family activity log—and representing it graphically, making learning interactive and fun. Involving children in these activities not only strengthens their graph reading abilities but also promotes teamwork and communication skills.
Ultimately, nurturing graph reading skills ensures that children develop a crucial competency that will benefit them academically and ultimately in real-world situations. Choosing to prioritize this area of learning is an investment in their future success.


