Understanding graphs Numbers Worksheets for Ages 6-8
3 filtered results
-
From - To
Unlock your child's potential with our "Understanding Graphs Numbers Worksheets" designed for ages 6-8! These engaging worksheets help young learners grasp essential graphing skills by exploring various types of graphs, such as bar graphs and pictographs. Through interactive activities, kids will develop their ability to interpret data, recognize trends, and answer questions based on visual information. Our resources not only strengthen math skills but also foster critical thinking and analytical abilities. Perfect for classroom use or home learning, these worksheets allow children to build confidence in understanding graphs while having fun. Start their learning journey today and watch them thrive!

Making a Graph: Creepy Crawlies Worksheet
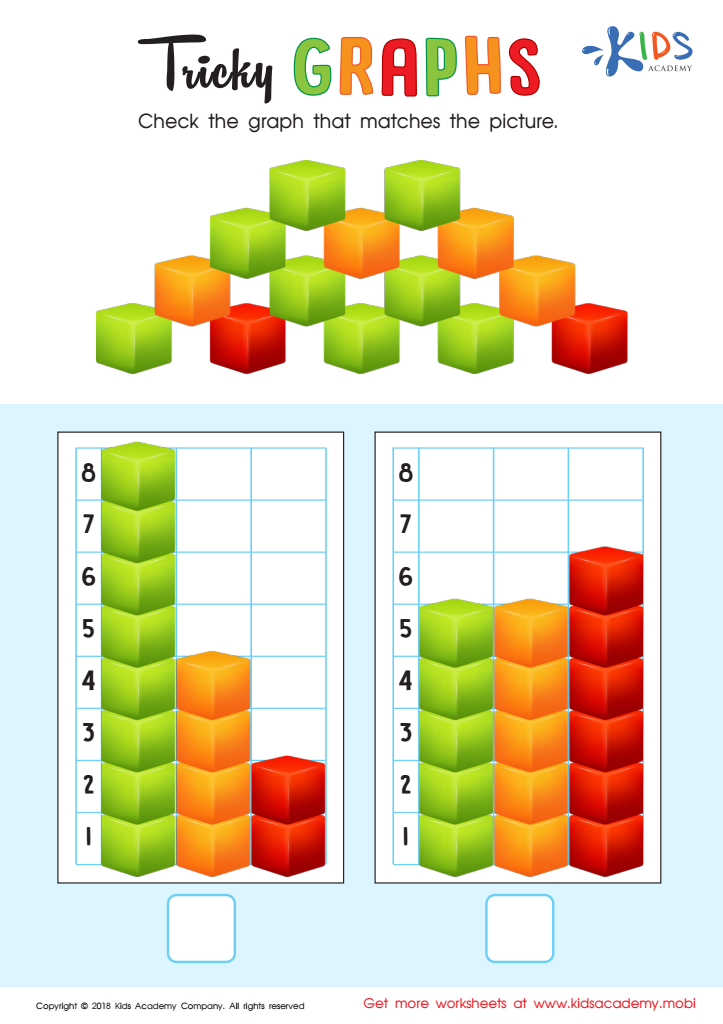
Tricky Graphs Worksheet

Match Tally Marks to Bar Graphs Worksheet


Understanding graphs and numbers is crucial for children ages 6-8, as it lays the foundation for their mathematical literacy and critical thinking skills. During these formative years, children are naturally curious and eager to engage with the world around them. By teaching them how to interpret graphs, parents and teachers empower them to visualize and analyze data effectively.
Graphs represent information in a structured way, making complex ideas simpler to grasp. They help children understand relationships, trends, and comparisons, which are vital skills in daily life and future academic pursuits. For instance, a bar graph showing favorite fruits can stimulate discussions about preferences and quantities, enhancing both mathematical and language skills.
Additionally, familiarity with numbers and graphing fosters an appreciation for mathematics, reducing math anxiety as children progress into higher grades, where these skills become increasingly important. Encouraging children to discuss and explore data fosters collaboration and communication—skills essential for teamwork.
In essence, supporting young learners in understanding graphs and numbers cultivates a love for learning, instills problem-solving abilities, and equips them with skills necessary for their future, making it a priority for both parents and educators. It’s an investment in their overall cognitive development.