Interpreting data Worksheets for 7-Year-Olds
7 filtered results
-
From - To
Unlock the power of learning with our “Interpreting Data Worksheets for 7-Year-Olds.” Tailored for young learners, these engaging worksheets help children explore the basics of data interpretation in a fun and easy-to-understand way. Designed by educators, our resources include colorful graphs, charts, and engaging questions that promote critical thinking and analytical skills. Whether comparing simple data sets or drawing conclusions from visuals, kids will gain confidence as they develop foundational math and reasoning abilities. Perfect for at-home learning or classroom activities, these worksheets make interpreting data enjoyable while fostering essential skills for future academic success. Start your adventure in learning today!
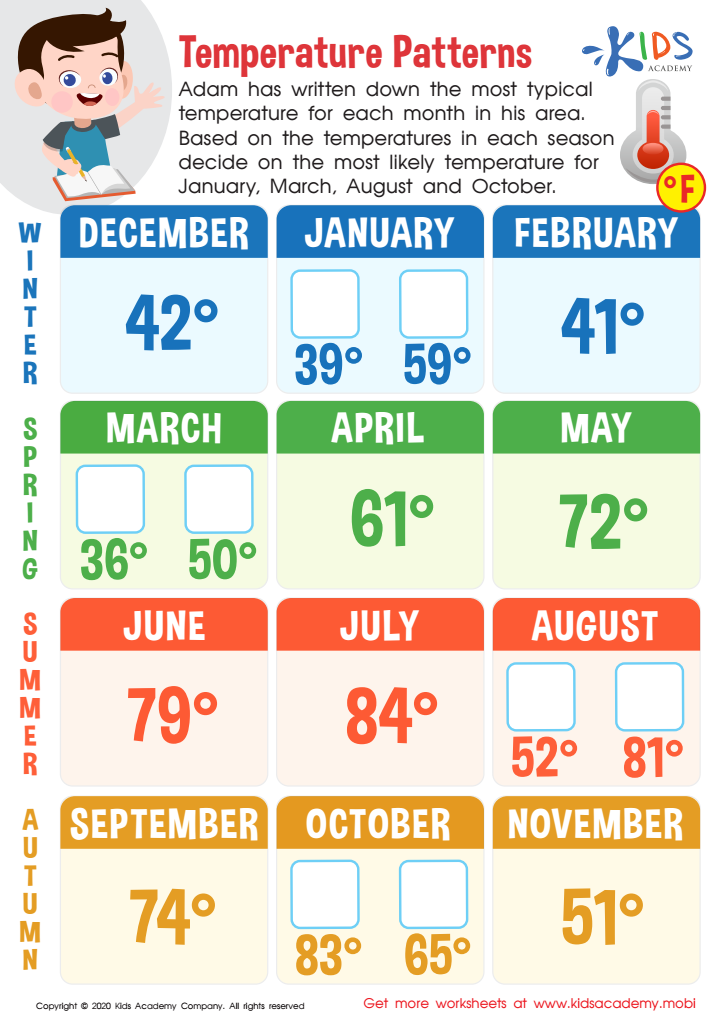
Temperature Patterns Worksheet
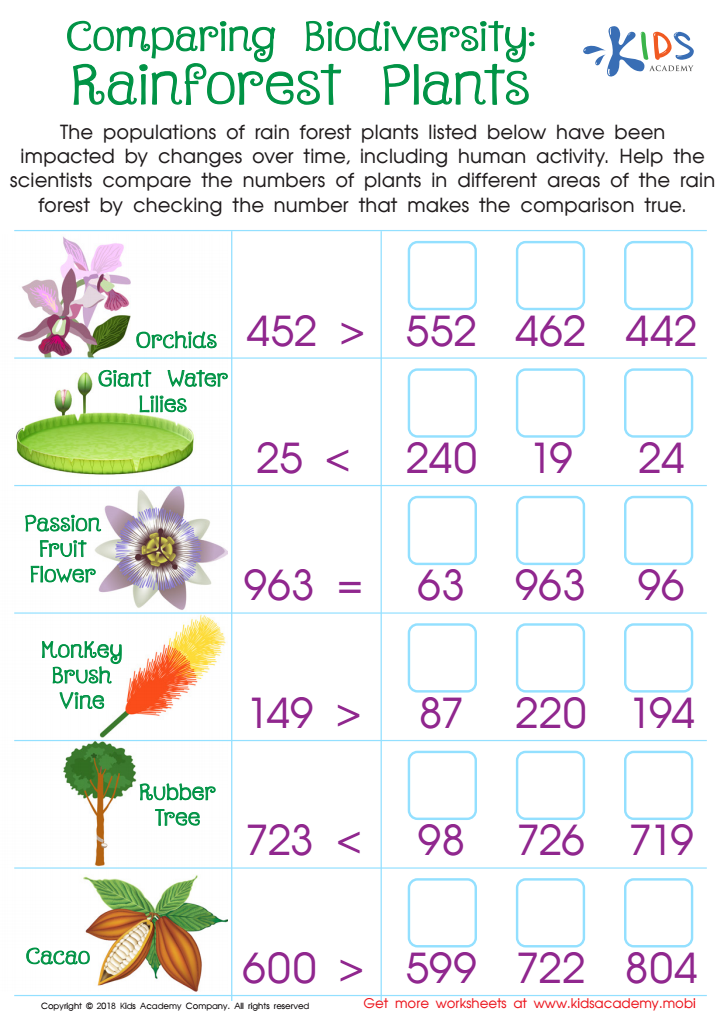
Comparing Biodiversity: Rainforest Plants Worksheet

Match Tally Marks to Bar Graphs Worksheet
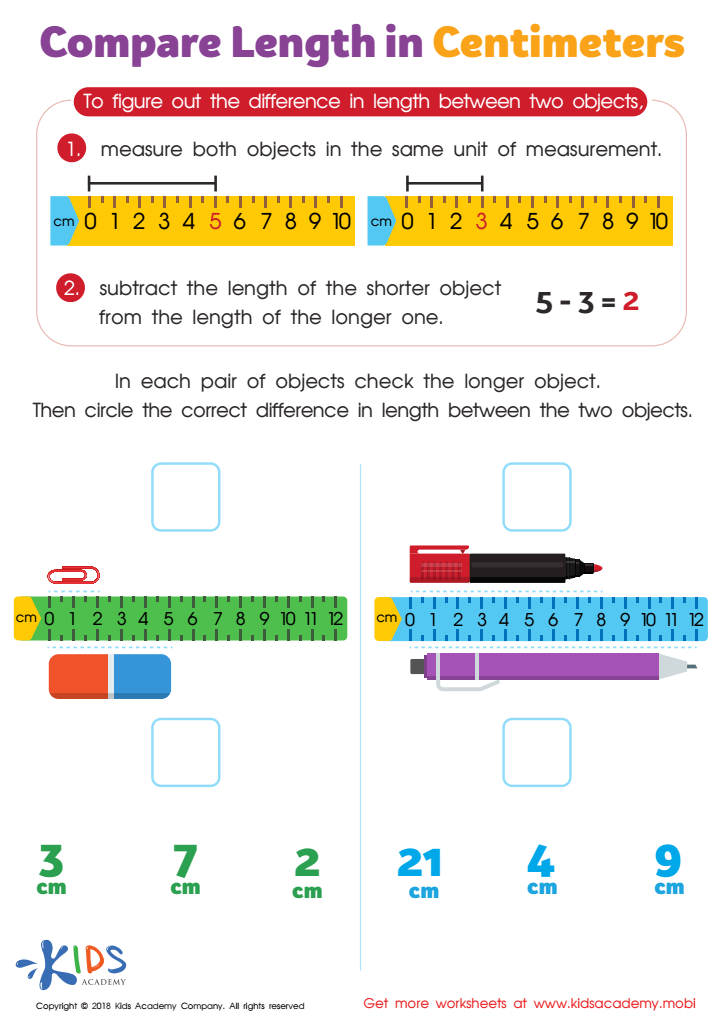
Compare Length in Centimeters Worksheet

Pencil Case Line Plot Worksheet
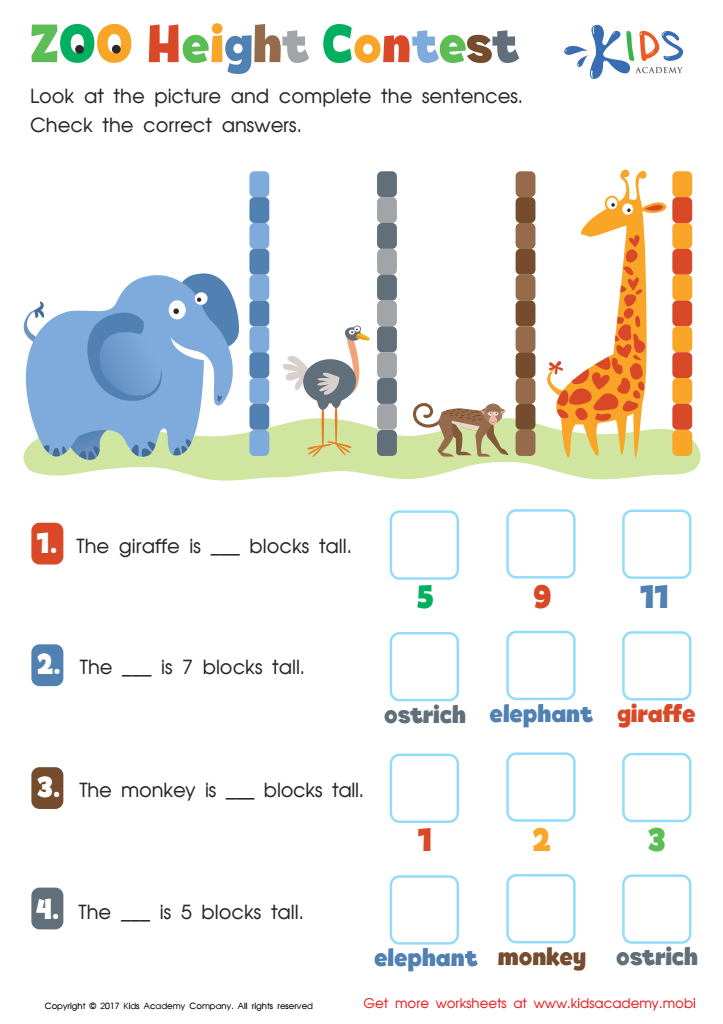
Zoo Height Contest Worksheet

Family Line Plot Worksheet


Interpreting data is a fundamental skill that shapes a child's understanding of the world, and it becomes particularly crucial for 7-year-olds as they navigate both academic content and daily life. At this age, children start to grasp the concept of data in various forms—such as numbers, charts, graphs, and surveys—which can enhance their learning and critical thinking abilities.
Parents and teachers should care about teaching data interpretation because it cultivates analytical skills that promote informed decision-making. For instance, understanding simple graphs can help children visualize information and trends, making them more adept at approaching subjects like math and science. Moreover, data interpretation encourages curiosity, as kids learn how to ask questions, explore possibilities, and draw conclusions based on observations.
Furthermore, in an age where technology and data dominate, equipping children with these skills prepares them for future challenges. It helps them to discern information critically in an increasingly complex world, fostering a mindset centered on problem-solving and evidence-based conclusions. Ultimately, nurturing these abilities not only supports academic growth but also empowers children to develop confidence in their decision-making and advocacy as they engage with real-world issues.


