Understanding line plots Measurement Worksheets for 7-Year-Olds
9 filtered results
-
From - To
Welcome to our "Understanding Line Plots Measurement Worksheets" designed specifically for 7-year-olds! These engaging and interactive worksheets aim to help young learners grasp the concepts of line plots and measurement in a fun and approachable way. Students will explore data representation, learn to interpret information, and practice creating their own line plots based on collected measurements. Aligned with age-appropriate learning objectives, these resources are perfect for reinforcing math skills in the classroom or at home. Encourage a love for learning and build foundational skills in measurement with our easy-to-follow worksheet activities, enhancing both understanding and confidence in young mathematicians!

What Is a Line Plot? Worksheet

Students Line Plot Worksheet
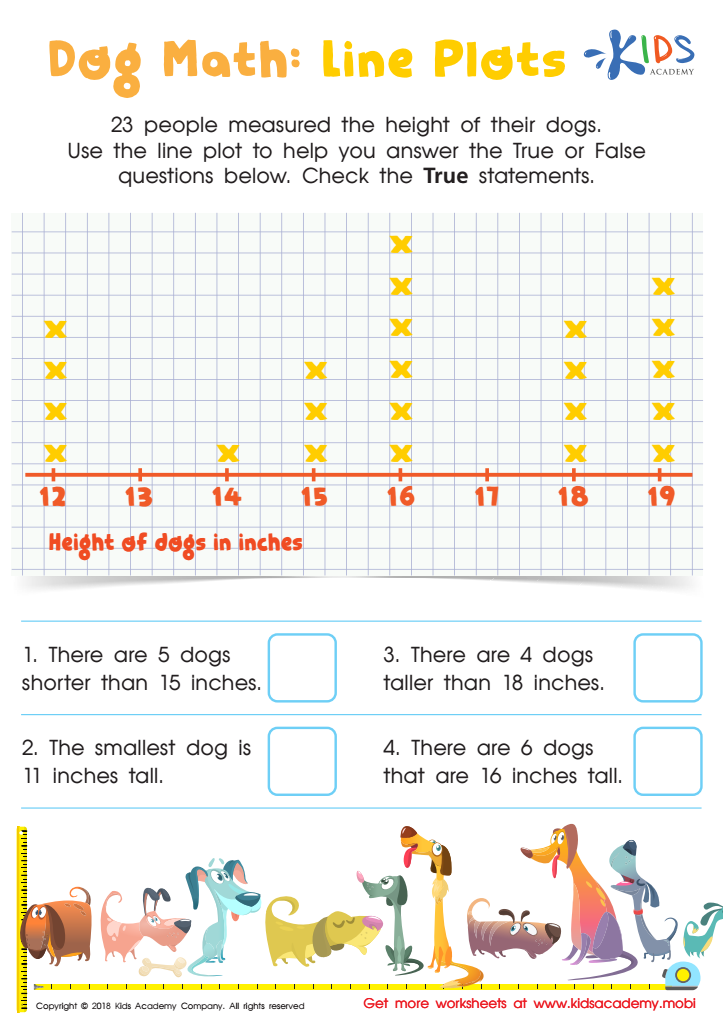
Dog Math: Line Plots Worksheet

Pencil Case Line Plot Worksheet

Line Plot Worksheet
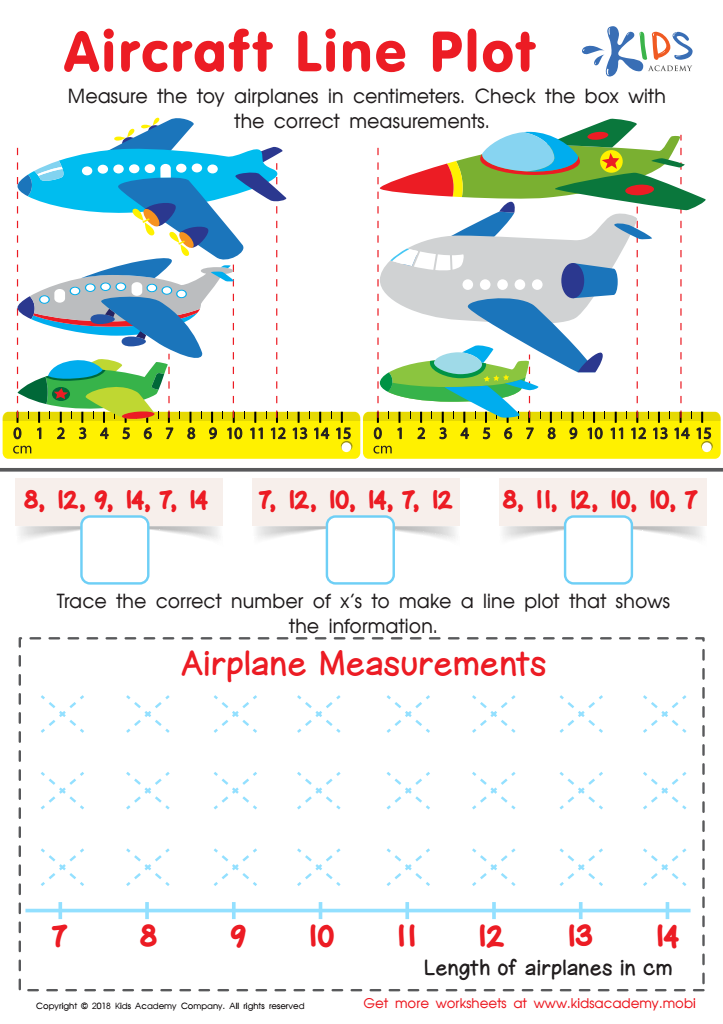
Aircraft Line Plot Worksheet

Family Line Plot Worksheet
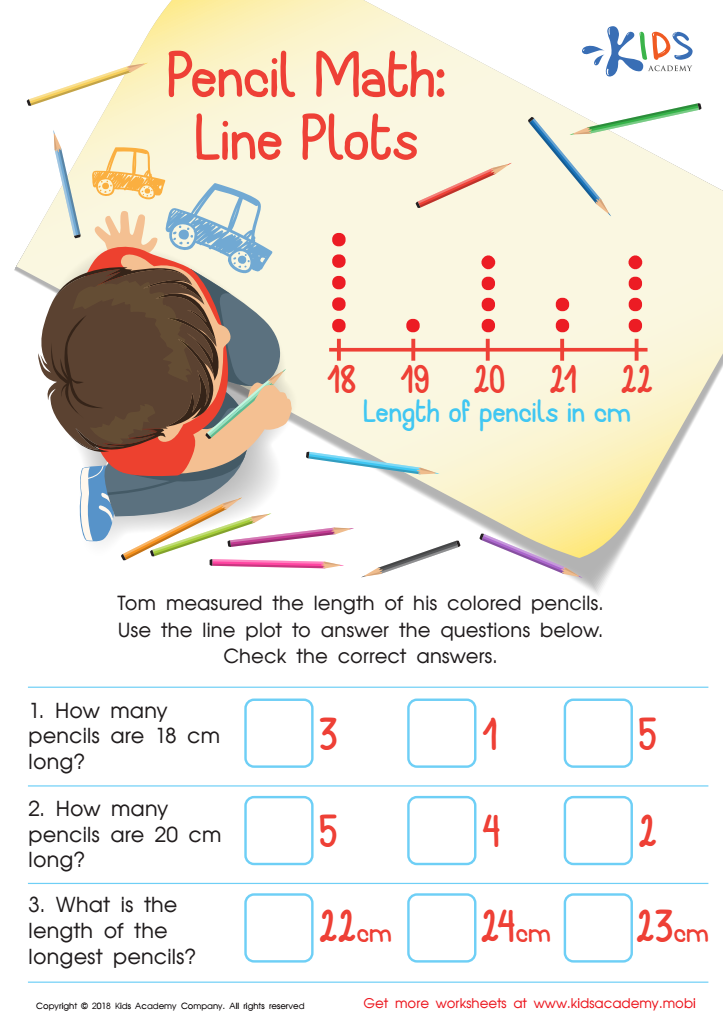
Pencil Math: Line Plots Worksheet
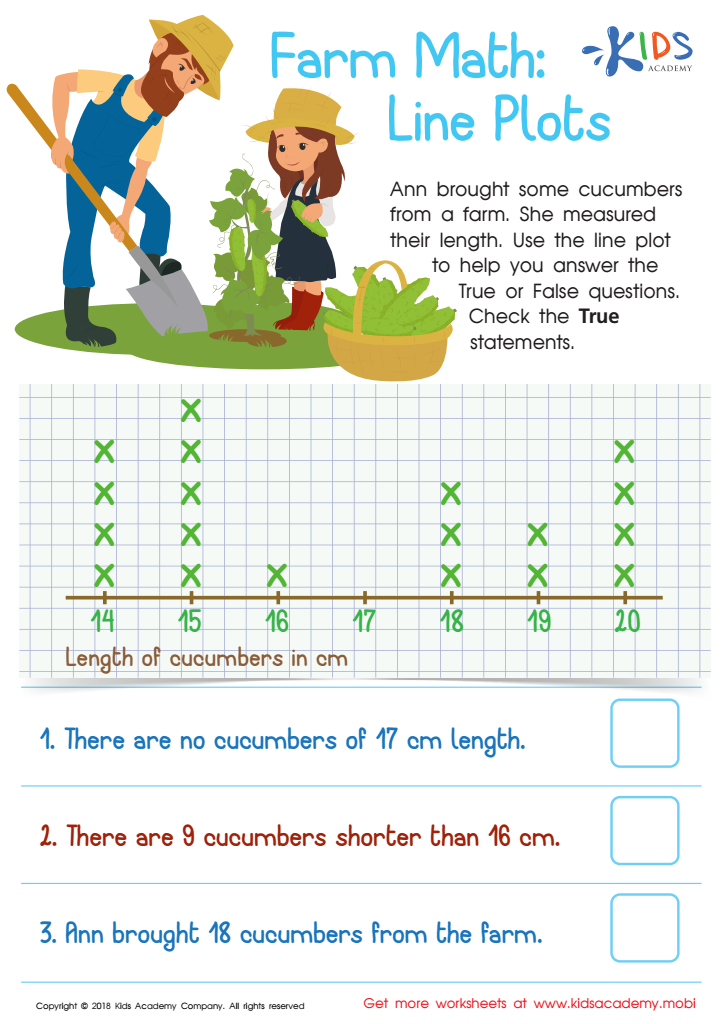
Farm Math: Line Plots Worksheet


Understanding line plots is crucial for 7-year-olds as it enhances their foundational math skills and promotes critical thinking. Line plots are visual representations of data, showing how values relate to each other in an accessible and straightforward manner. By learning to read and create line plots, children can better grasp concepts of measurement, which is essential in everyday life.
Parents and teachers should care because line plots help children develop analytical skills. For instance, they learn to interpret data by identifying trends, comparing quantities, and recognizing patterns. These skills are vital not just in mathematics, but in science and social studies as well.
Moreover, understanding line plots encourages data literacy—a critical skill in the digital age where information is readily available. Engaging children in hands-on activities using line plots allows them to apply math in real-world contexts, making learning enjoyable and relevant.
Additionally, this knowledge builds confidence in problem-solving, as children see the direct application of mathematics in analyzing everyday situations. Ultimately, supporting children in understanding line plots equips them with the tools they need for academic success and informed decision-making in life.


