Interpreting data Worksheets for 9-Year-Olds
3 filtered results
-
From - To
Unlock your child's potential in understanding data with our specially designed Interpreting Data Worksheets for 9-Year-Olds. These engaging and age-appropriate resources from Kids Academy provide plentiful opportunities for young learners to develop essential skills in reading graphs, analyzing charts, and interpreting various data sets. Each worksheet combines fun activities with educational value, allowing kids to practice critical thinking and problem-solving while enhancing their ability to comprehend and use information effectively. Perfect for classroom use or homeschooling, these worksheets will transform data interpretation into a captivating and rewarding experience for your nine-year-old. Visit Kids Academy to explore this enriching collection!
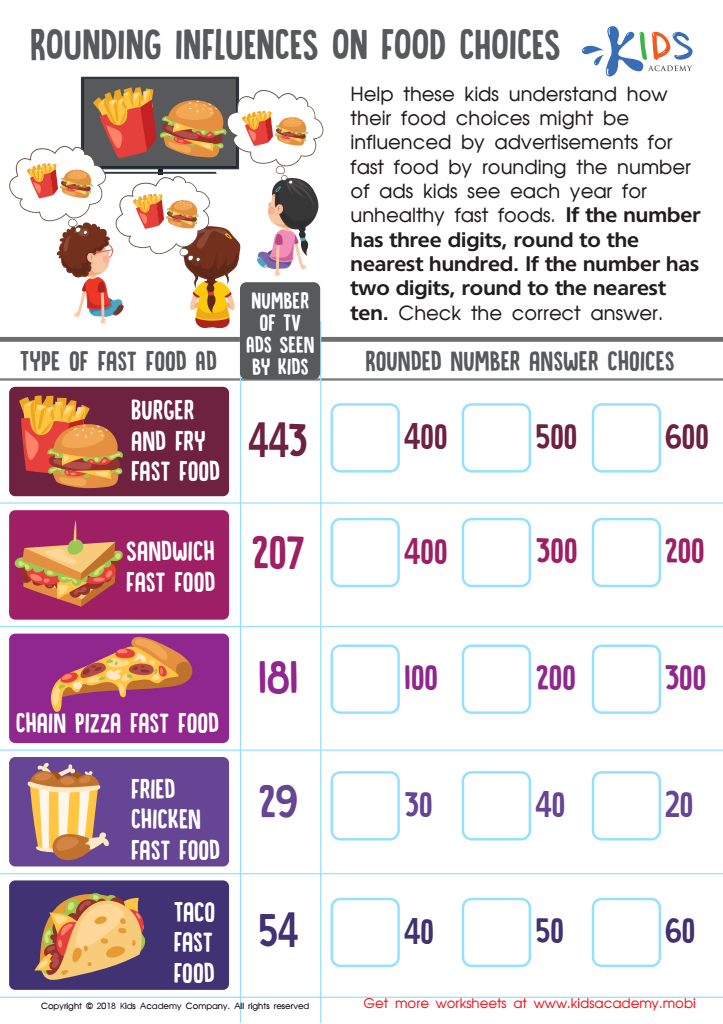
Rounding Influences Food Choices Worksheet

Interpret Line Plot Worksheet

Leaf Bar Graph Worksheet


Interpreting data is a cornerstone skill for 9-year-olds that parents and teachers should prioritize. At this developmental stage, children are beginning to sharpen their critical thinking and problem-solving abilities, and data interpretation helps solidify these areas. Understanding and analyzing data foster logical reasoning and allow children to draw conclusions based on evidence. This is instrumental not just in mathematics, but across subjects like science and social studies, where data interpretation is commonly applied.
Moreover, learning how to interpret data equips children with tools to navigate the information-rich world they inhabit. They become adept at distinguishing relevant facts from irrelevant information, a crucial skill in this age of information overload. By engaging with data, whether in the form of charts, graphs, or simple surveys, children learn to ask questions, make predictions, and validate those predictions through empirical evidence.
Additionally, mastering data skills at a young age underscores the importance of accuracy and careful analysis, creating a strong foundation for future academic pursuits and lifelong learning. Children who excel in data interpretation are often better prepared to tackle more advanced concepts in later grades. Therefore, instilling this proficiency early on can lead to sustained academic success and a deeper understanding of the world around them.


