Graphs Worksheets for Ages 3-8 - Page 2
27 filtered results
-
From - To
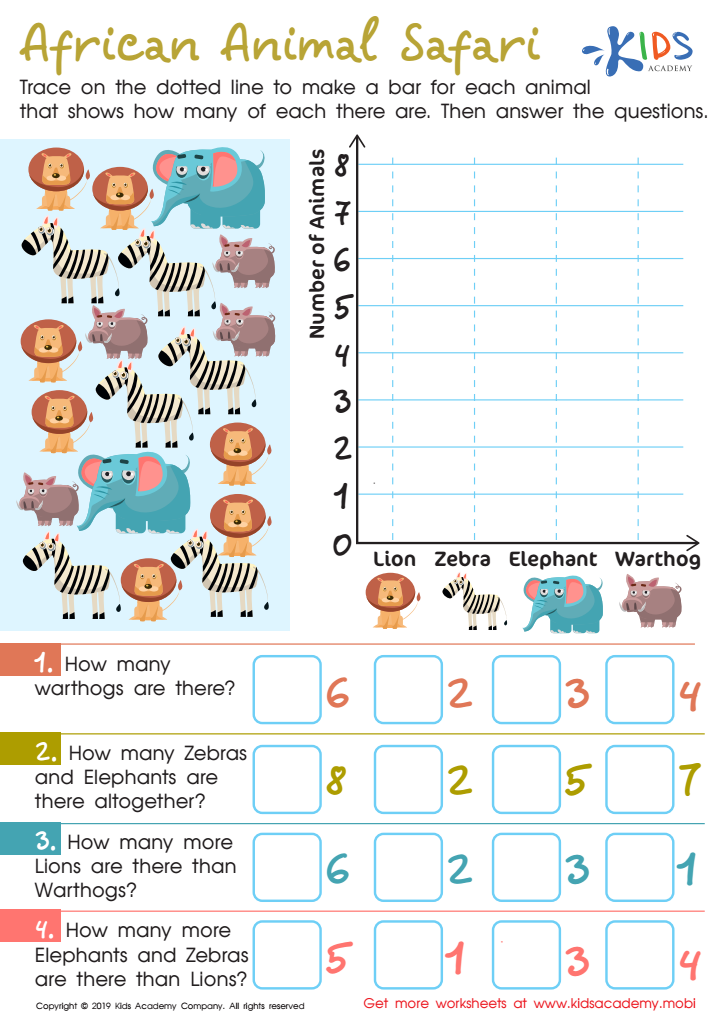
African Animal Safari Worksheet

Leaf Measure Line Plot Worksheet

Football Math Worksheet


Graphs serve as a fundamental tool for young learners aged 3-8, providing an engaging way to visualize and understand information. Parents and teachers should care about graphs for several reasons.
Firstly, graphs help develop critical thinking skills. By interpreting bar charts, line graphs, or pictographs, children learn to analyze data, identify patterns, and draw conclusions—skills that are vital in today's data-driven world.
Secondly, graphs encourage mathematical understanding. Through the process of creating and reading graphs, children practice counting, sorting, and categorizing, foundational skills for later math concepts. This visual representation reinforces the idea that numbers have real-world applications.
Moreover, introducing graphs in early education promotes communication skills. As children describe their graphs, they articulate thoughts and ideas, enhancing their vocabulary and expression.
Additionally, working with graphs fosters collaborative learning. Students can engage with peers through discussions about data, while parents can use family activities—like tracking weather or garden growth—to emphasize mathematical thinking at home.
In essence, encouraging the use of graphs not only equips young learners with essential skills and knowledge but also makes learning enjoyable and relatable. This foundation sets the stage for future success in academics and everyday problem-solving.


