Graphs Worksheets for Ages 4-8 - Page 2
27 filtered results
-
From - To
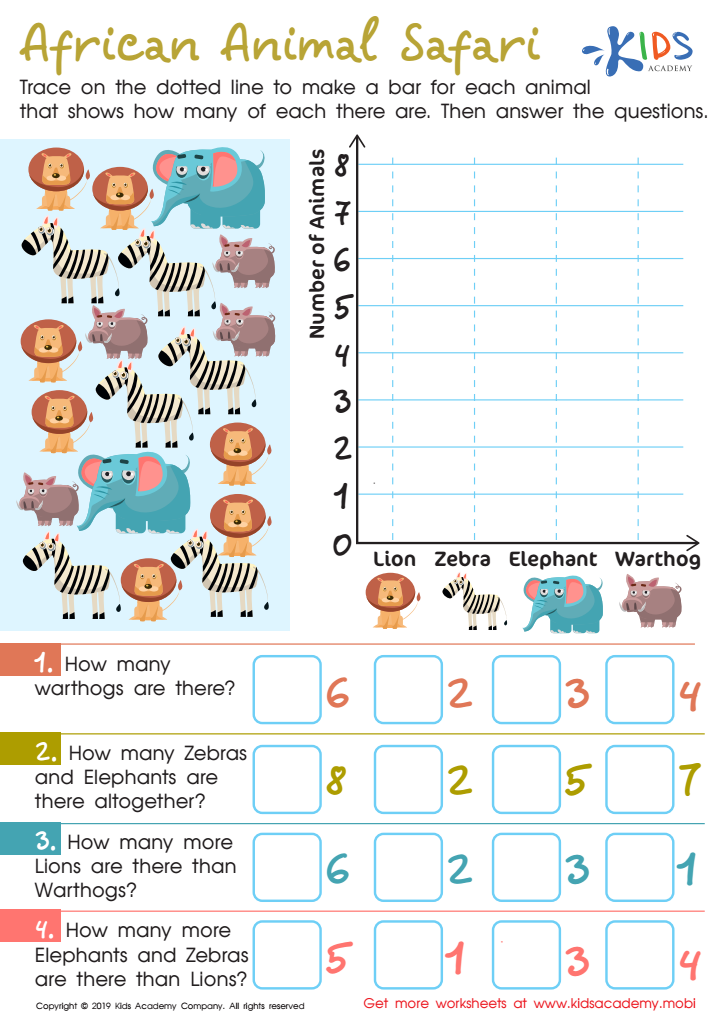
African Animal Safari Worksheet

Leaf Measure Line Plot Worksheet

Football Math Worksheet


Introducing graphs to children aged 4-8 is essential because it lays the groundwork for critical thinking and data interpretation skills that they will use throughout their education and life. At this young age, children are naturally curious and adept at recognizing patterns, making it an ideal time to introduce basic graphing concepts.
Graphs offer a visual and interactive way for kids to understand and manage information. By representing data graphically, concepts that might seem complex can become much simpler and more accessible for young learners. For instance, bar graphs or pie charts can be used to count and compare quantities, enhancing their numerical and analytical abilities.
Graphing activities can also promote problem-solving skills. As children collect data—such as counting the number of different-colored candies in a jar—and represent it on a graph, they learn to make predictions, draw conclusions, and ask questions, fostering a scientific mindset.
Moreover, working on graphs helps improve organizational skills. If students categorize objects and plot them on a chart, they not only practice organizing data but can visually see relationships and trends, enhancing their logical thinking.
Ultimately, making graphs fun and engaging at a young age sets a strong educational foundation, benefiting children's cognitive development and preparing them for more advanced concepts in math, science, and everyday decision-making.


