Data interpretation Easy Measurement Worksheets for Ages 8-9
7 filtered results
-
From - To
Explore our engaging Data Interpretation Easy Measurement Worksheets, designed specifically for children aged 8-9! These worksheets help young learners enhance their data analysis skills by interpreting simple graphs, charts, and tables. With a variety of fun and interactive activities, students will gain confidence in understanding measurements and using data effectively. Our worksheets align with educational standards, making it easy for teachers and parents to support learning at home or in the classroom. Perfect for practicing critical thinking and analytical skills, these resources ensure a comprehensive understanding of data interpretation while making learning enjoyable! Start exploring today for a brighter math experience!

Fruit Math: Picture Graphs Worksheet

Students Line Plot Worksheet
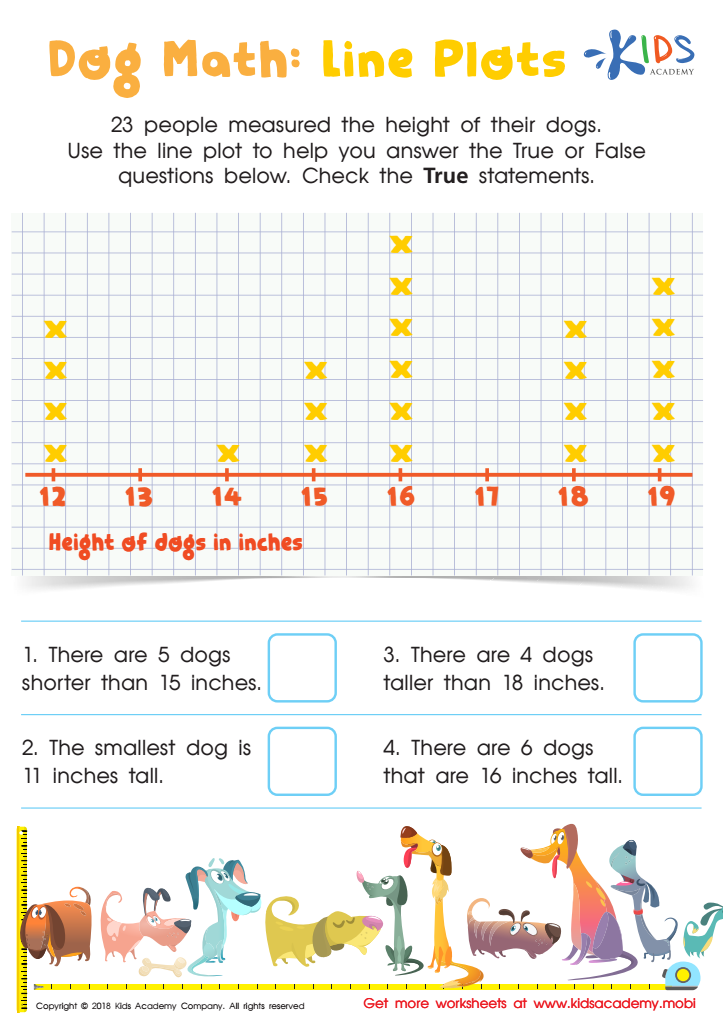
Dog Math: Line Plots Worksheet
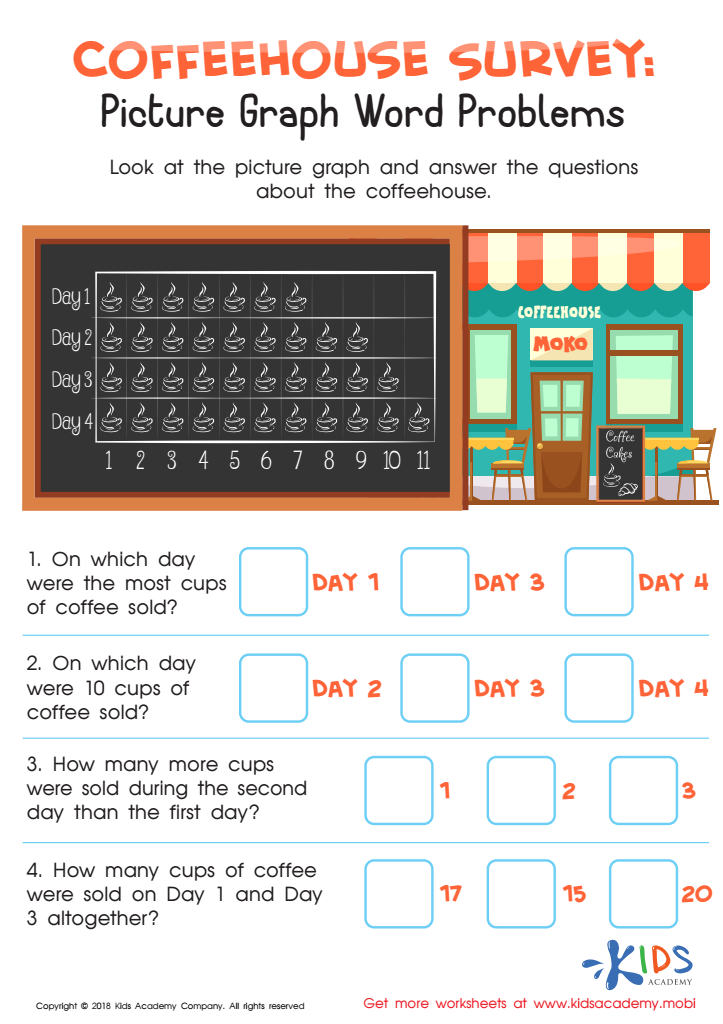
Coffeehouse Survey: Picture Graph Word Problems Worksheet
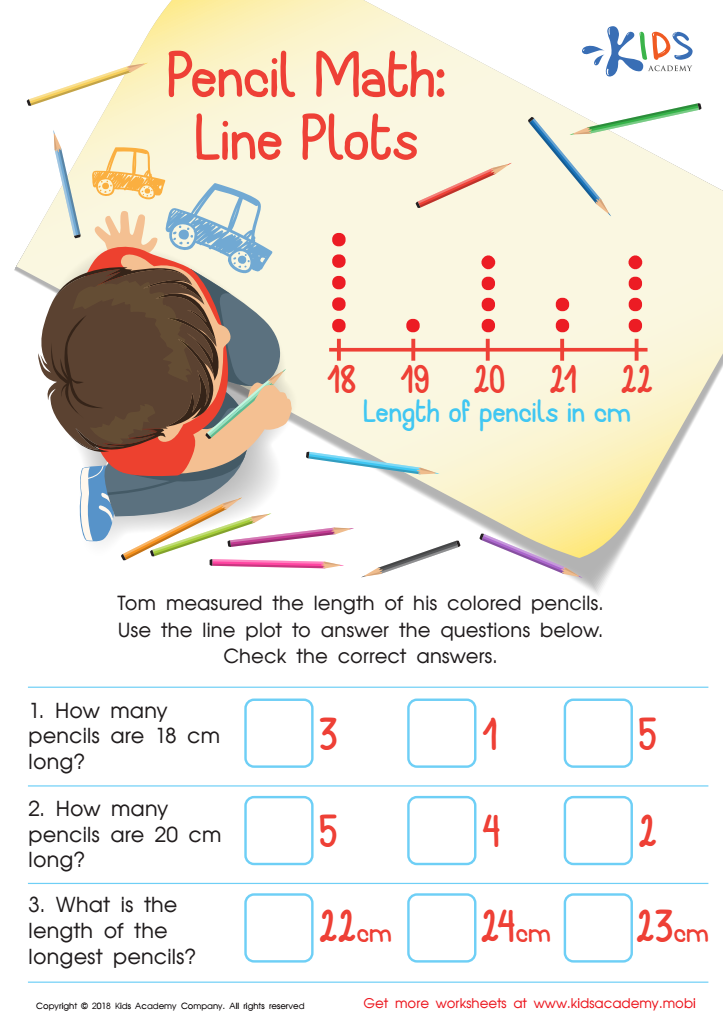
Pencil Math: Line Plots Worksheet
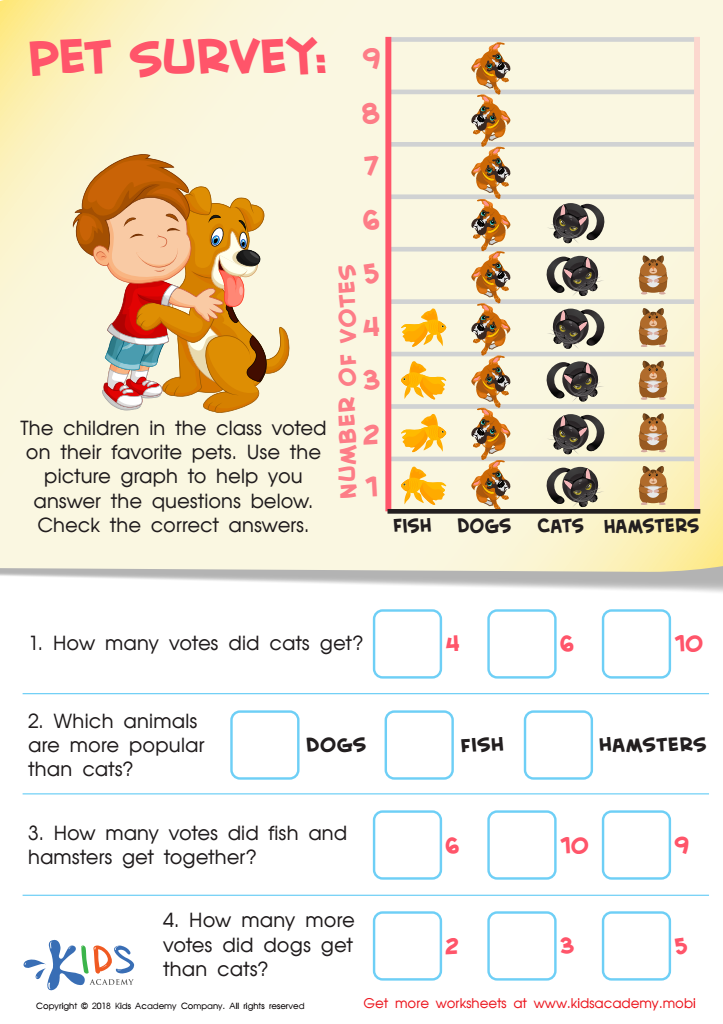
Pet Survey Worksheet
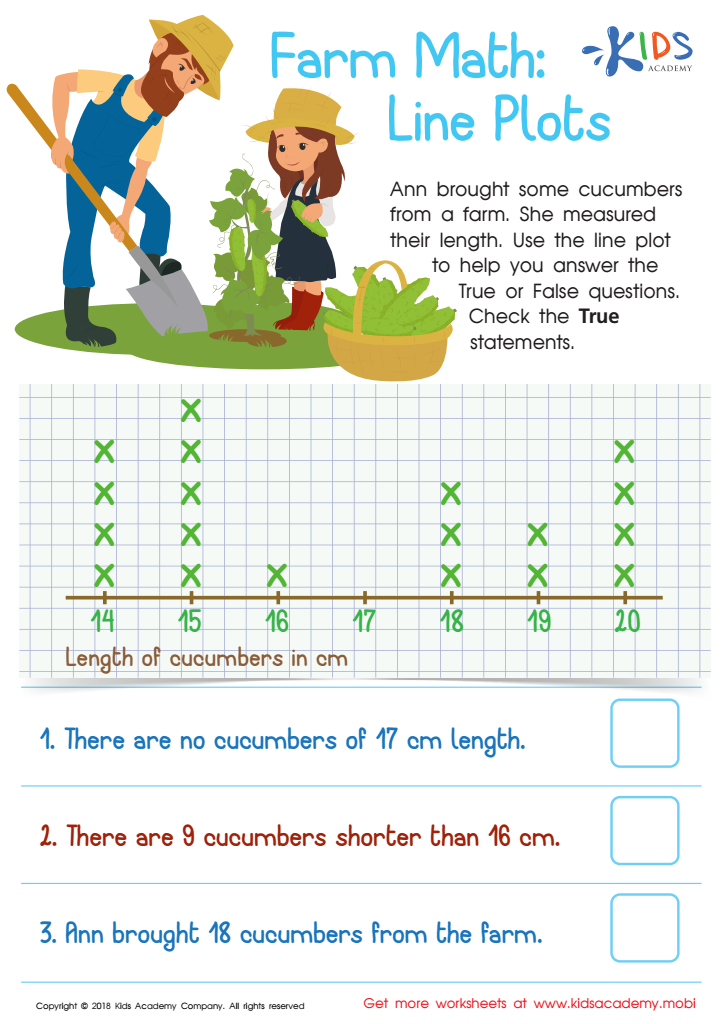
Farm Math: Line Plots Worksheet


Data interpretation and measurement are crucial skills for children aged 8-9, forming a foundation for critical thinking and problem-solving. At this stage, children are becoming more adept at handling numbers and graphs, making it essential for parents and teachers to engage them in learning these concepts. Understanding data interpretation helps children make sense of the information they encounter daily, from weather reports to sports statistics, fostering informed decision-making.
Moreover, easy measurement introduces students to quantitative thinking, helping them grasp fundamental mathematical principles in a practical context. Learning how to measure dimensions, time, and money connects them to real-life situations, enhancing their engagement and interest in math. This knowledge also supports cross-curricular learning, tying in science, health, and economics.
Encouraging children to analyze and interpret data encourages a mindset of inquiry, empowering them to ask questions and seek answers, skills essential for future academic success. Furthermore, these foundational skills will benefit them in higher education and the job market, where data literacy is increasingly valued. In short, establishing strong data interpretation and measurement skills at this young age prepares children for future challenges, promotes a lifelong love of learning, and equips them with tools to navigate an increasingly data-driven world.