Data interpretation Easy Worksheets for 8-Year-Olds
8 filtered results
-
From - To
Discover our engaging data interpretation worksheets designed for 8-year-olds! These easy-to-follow resources help children develop critical skills in analyzing and understanding data. With fun graphics and interactive activities, students can practice interpreting charts, graphs, and tables while enhancing their mathematical abilities. Each worksheet is crafted to make learning enjoyable and accessible, encouraging children to confidently draw conclusions and make predictions based on their findings. Perfect for reinforcing classroom lessons or for home study, our data interpretation worksheets provide a solid foundation for young learners to explore the exciting world of data. Start your educational journey today!

Fruit Math: Picture Graphs Worksheet

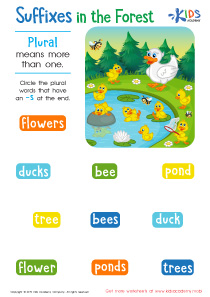
Students Line Plot Worksheet
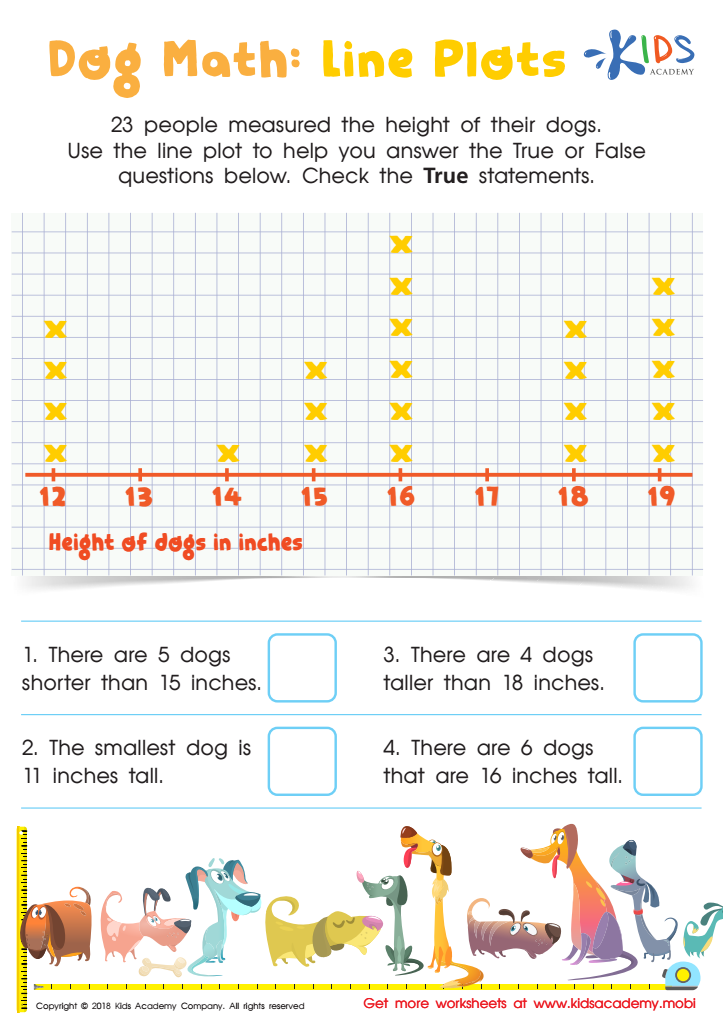
Dog Math: Line Plots Worksheet
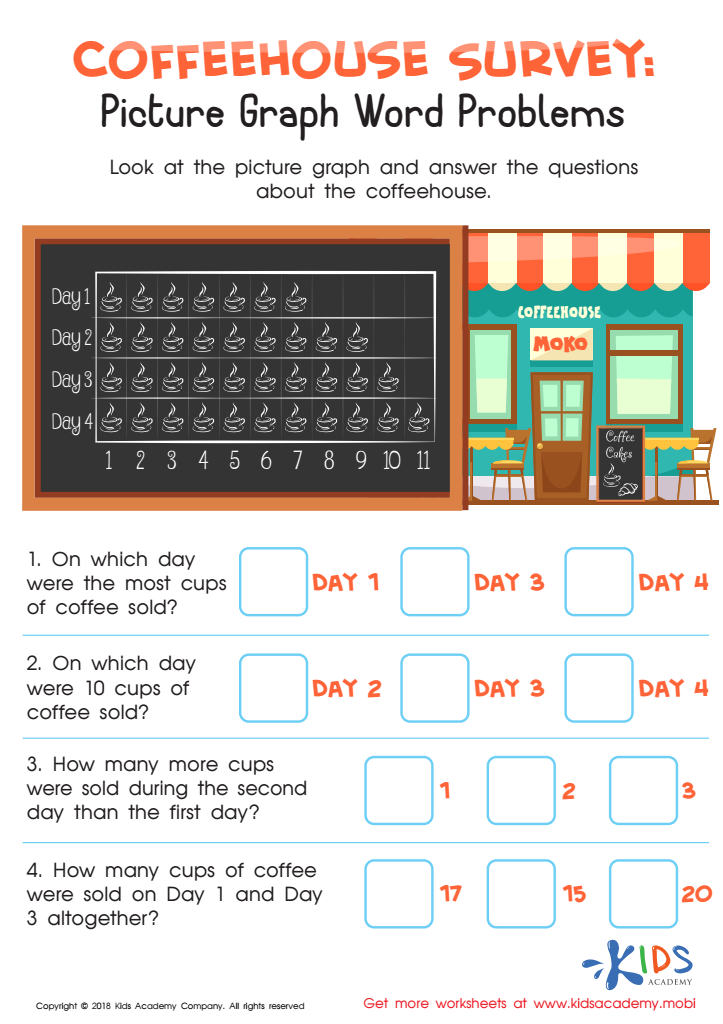
Coffeehouse Survey: Picture Graph Word Problems Worksheet

Aircraft Carrier Picture Graphs Worksheet
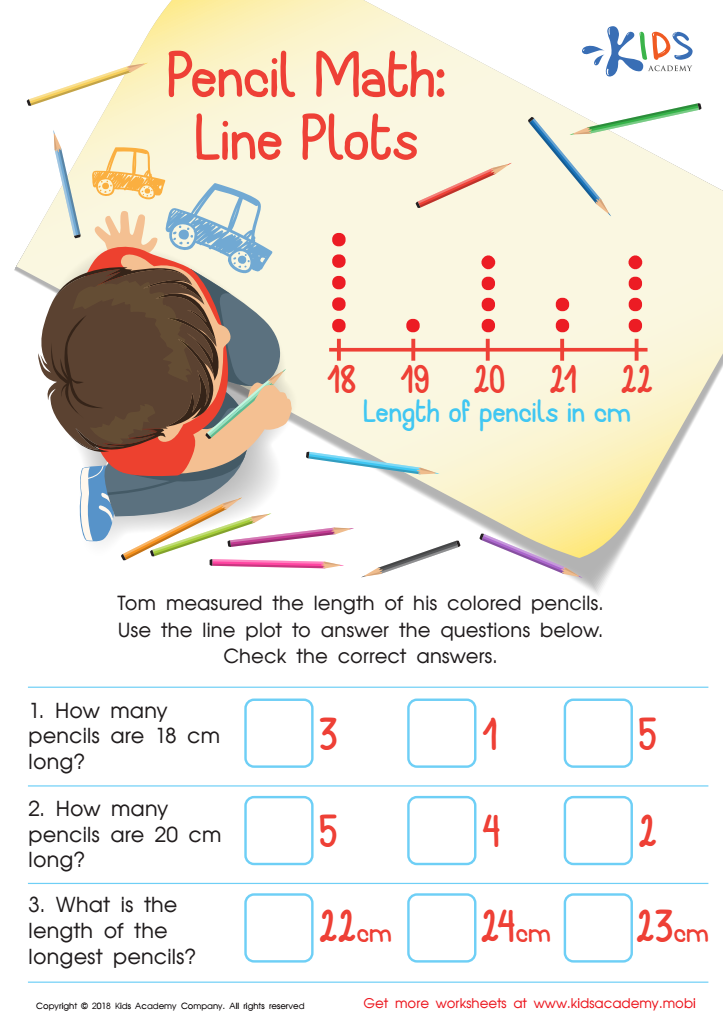
Pencil Math: Line Plots Worksheet
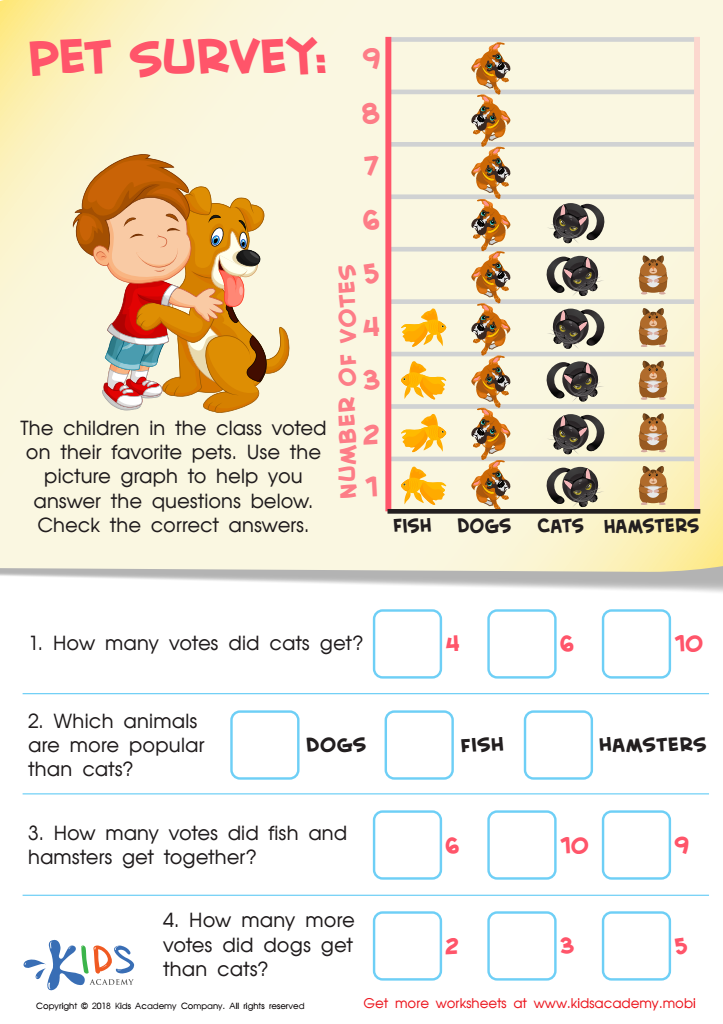
Pet Survey Worksheet
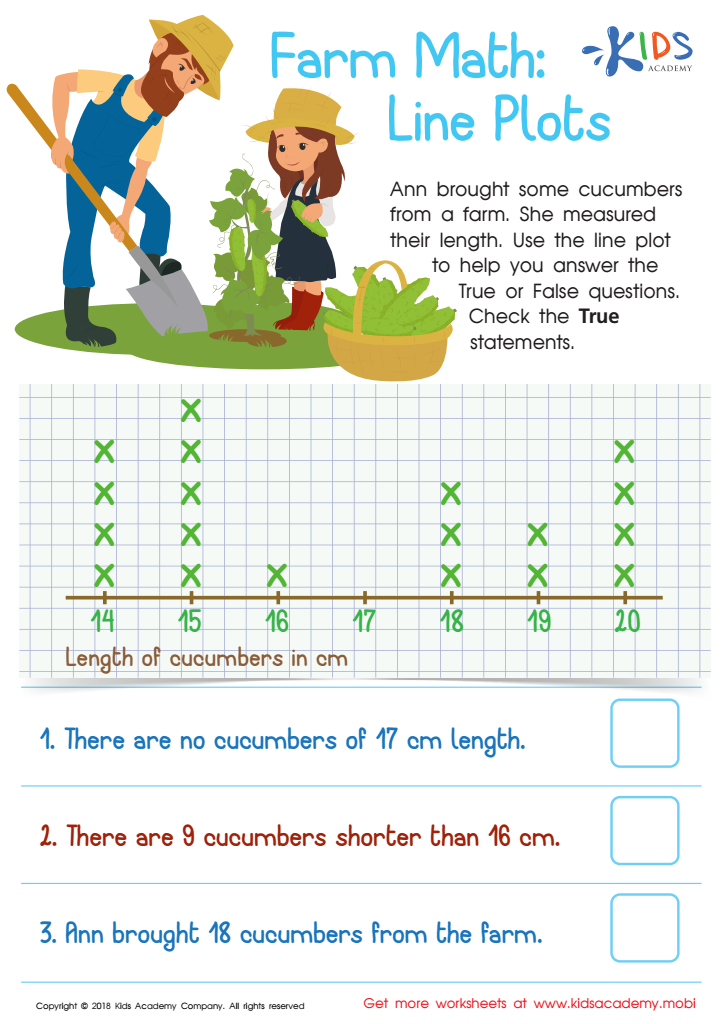
Farm Math: Line Plots Worksheet


Data interpretation is an essential skill for children, especially for 8-year-olds, who are at a crucial stage of developing critical thinking. Parents and teachers should care about this because it helps kids make sense of the world around them. When children learn how to read and understand charts, graphs, and tables, they become better decision-makers.
For instance, if an 8-year-old can interpret data from a simple survey about their favorite fruits, they can learn how to analyze preferences and understand that opinions can vary. This fosters confidence in using information to make choices. It also encourages curiosity as they explore questions like, "Why do more friends like apples than bananas?"
Moreover, data interpretation lays the groundwork for subjects like math and science. Kids learn to recognize patterns, compare quantities, and understand statistics, which are important throughout their education and future careers.
Ultimately, teaching data interpretation ensures that children grow into informed adults who can engage in civic discussions, understand news, and make sound decisions based on evidence. By promoting these skills early, parents and teachers are empowering children to think critically about information they encounter in everyday life.