Data interpretation Easy Grade 2 Math Worksheets
7 filtered results
Difficulty Level
Grade
Age
-
From - To
Subject
Activity
Standards
Explore our engaging Data Interpretation Easy Grade 2 Math Worksheets designed to enhance your child's mathematical skills! These printable worksheets focus on teaching young learners how to interpret simple data through fun and colorful graphs, charts, and tables. Perfect for second graders, each worksheet encourages critical thinking, promotes understanding of basic statistics, and helps students develop essential analytical skills. With varying levels of difficulty, these resources cater to different learning paces, making math accessible and enjoyable. Foster a love for learning as your child gains confidence in data interpretation. Download now and watch them excel in their math journey!
Favorites
With answer key
Interactive

Fruit Math: Picture Graphs Worksheet
Help your child learn to draw graphs by having them look at pictures. Ask them to identify a graph that accurately portrays the data and have them explain why. This will prepare them to easily draw more complex graphs in the future. For example, have them look at the picture with the number of fruits in the colorful worksheet and explain why the graph is accurate.
Fruit Math: Picture Graphs Worksheet
Worksheet

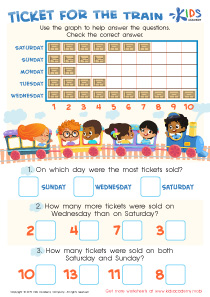
Students Line Plot Worksheet
Help your students learn to draw a line plot correctly by giving real examples. In this exercise, they must check the data of a class of 18 students' heights (in inches). Have them compare two line plots and figure out which one is correct.
Students Line Plot Worksheet
Worksheet
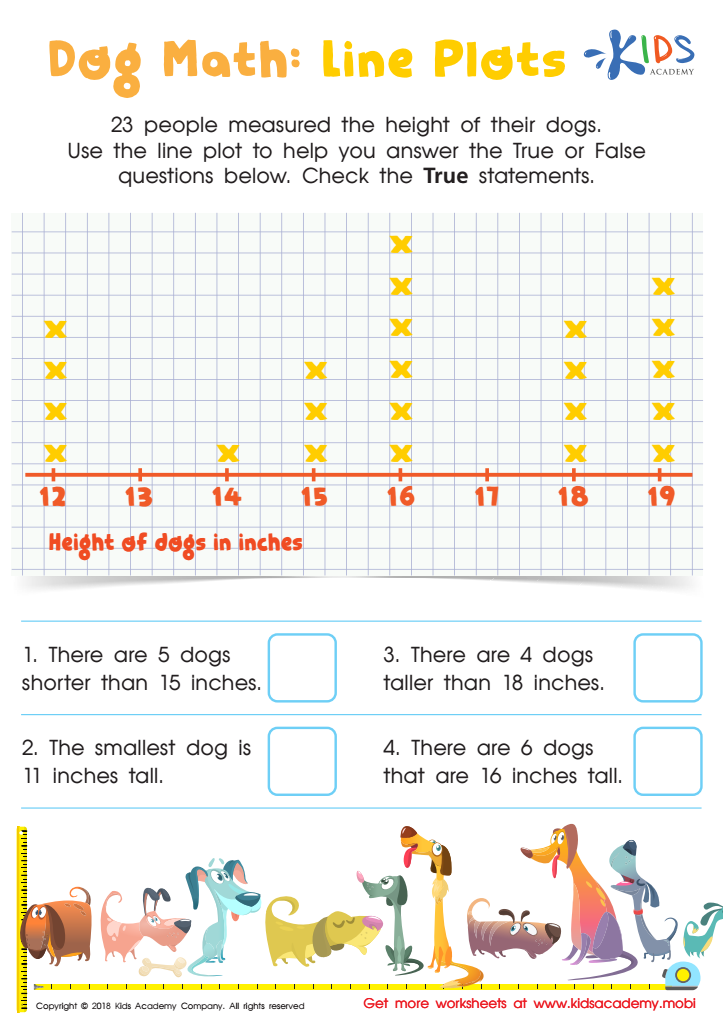
Dog Math: Line Plots Worksheet
Do your kids love dogs? If you have family pets, your kids may be excited to do this worksheet. It involves a line plot and True/False questions about 23 people measuring their dogs' heights. Assist your kids in verifying the statements that are True.
Dog Math: Line Plots Worksheet
Worksheet
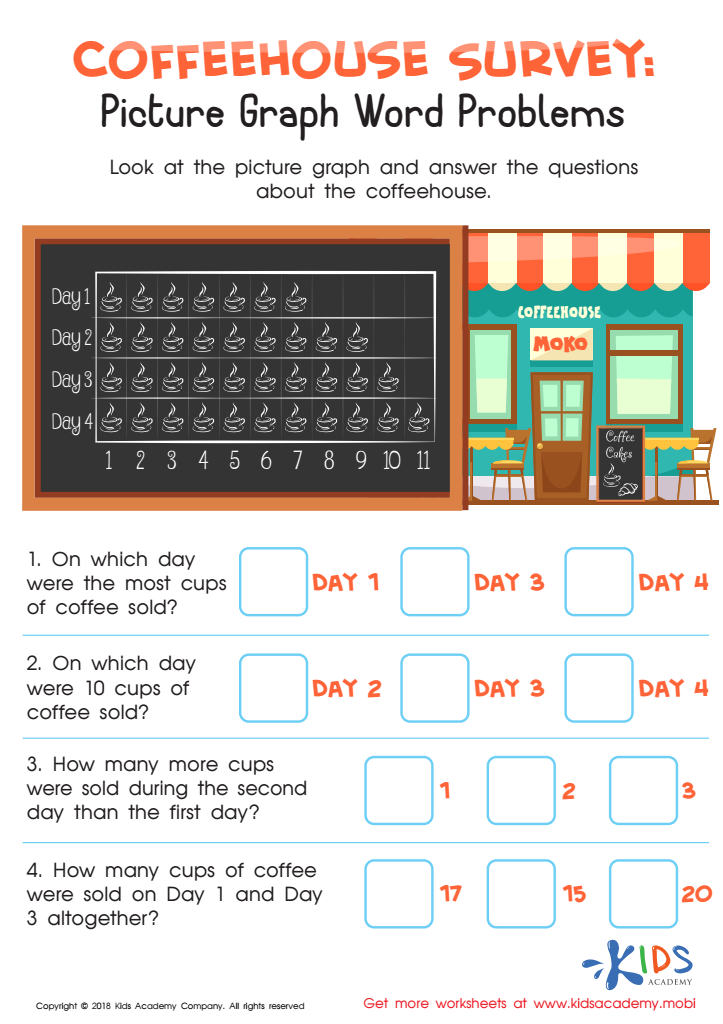
Coffeehouse Survey: Picture Graph Word Problems Worksheet
This coffeehouse survey helps children interpret pictures and answer questions. Your child will look at a picture graph displaying daily coffee cup sales from Day 1 to Day 4. Aid them in answering questions on the number of cups sold and which day had the most sales.
Coffeehouse Survey: Picture Graph Word Problems Worksheet
Worksheet
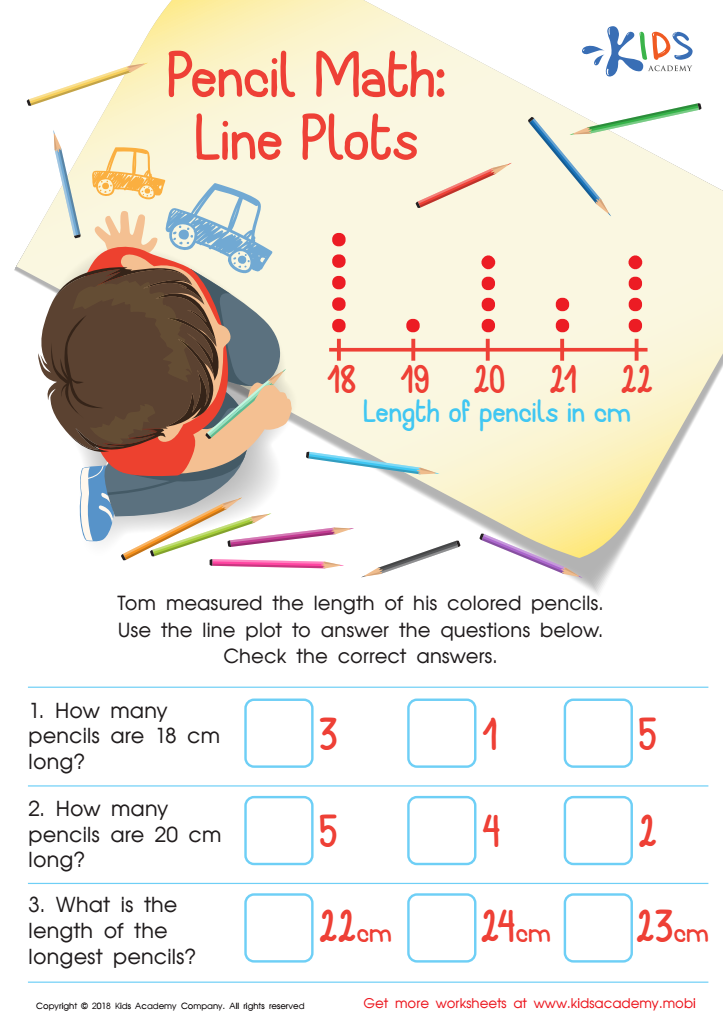
Pencil Math: Line Plots Worksheet
Your child will meet Tom in this worksheet, helping him find the length of his colored pencils. Tom has written the lengths in cm, and the line plot will help your kids answer the questions. Check the correct answers for each, including how many pencils are of a certain length. The line plot makes it easy to find the answers.
Pencil Math: Line Plots Worksheet
Worksheet
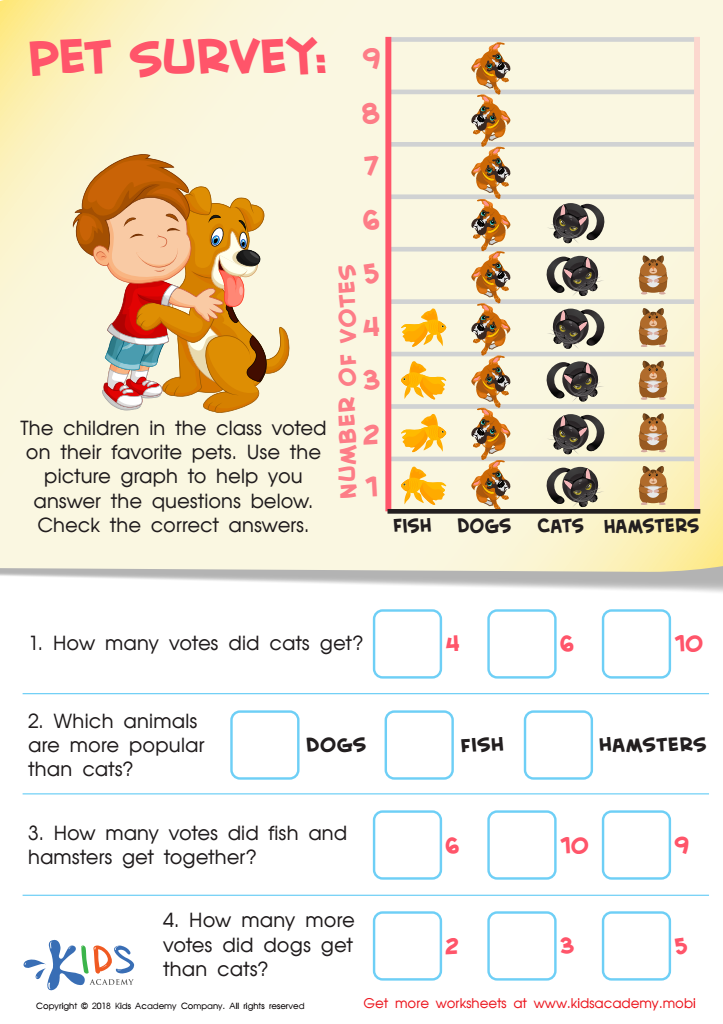
Pet Survey Worksheet
Do you have a furry family member? If the answer is yes and your kids love animals, they'll enjoy this worksheet. The picture graph shows the children's votes for their favorite pet - fish, dog, cat and hamster. Ask your child to use the graph to answer the questions. Guide them to check the right answer.
Pet Survey Worksheet
Worksheet
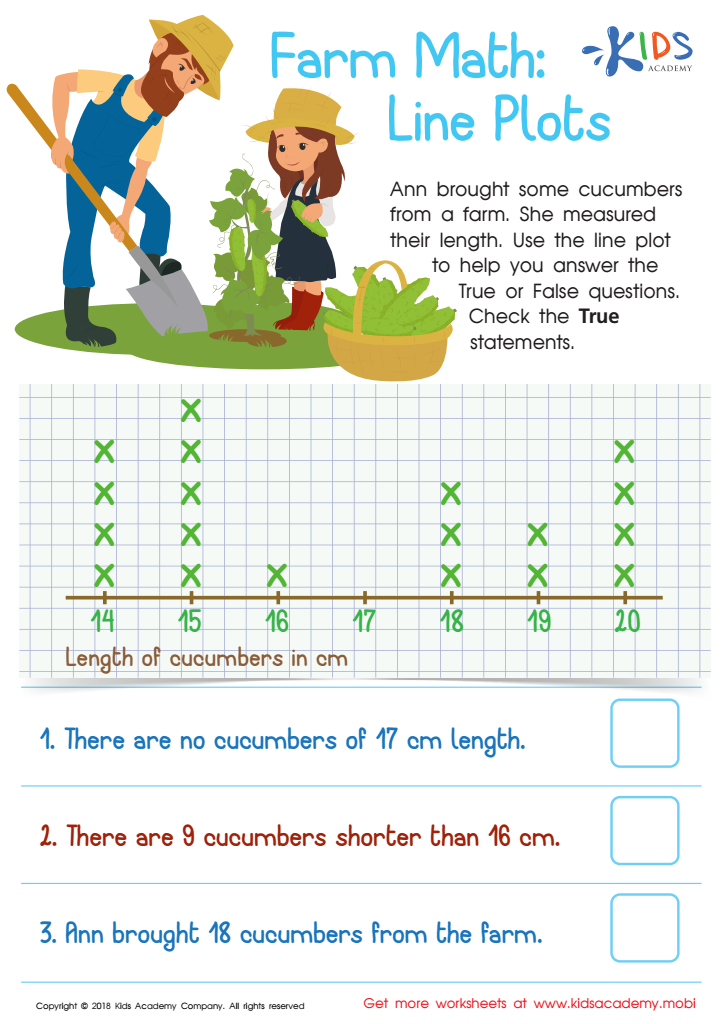
Farm Math: Line Plots Worksheet
Ann brought cucumbers from a farm and measured their length. She drew a line plot for your students to use to answer True/False questions about the number and length of the cucumbers. Ask your students to check only the True statements. (80 words)
Farm Math: Line Plots Worksheet
Worksheet
Join Kids Academy for Free
Who is primarily going to use this learning content?


Data interpretation is a foundational skill that helps Grade 2 students understand the importance of information in everyday life. When parents and teachers focus on teaching young learners how to interpret data, they equip them with critical thinking and analytical skills that are essential for academic and real-world scenarios.
In Grade 2, students begin to explore simple data sets, such as graphs, charts, and pictograms. This not only enhances their mathematical understanding but also fosters the ability to make informed decisions. For instance, interpreting data helps children evaluate trends, compare quantities, and even draw conclusions based on the information presented. Such skills promote curiosity and encourage children to ask questions and seek answers.
Moreover, mastering data interpretation at an early age builds a strong foundation for future learning in mathematics and the sciences. It supports the development of numeracy skills, which are crucial in our technology-driven society. As children become confident in working with data, they learn to express ideas clearly and present information visually, preparing them for more complex concepts later on.
Ultimately, emphasizing data interpretation in Grade 2 helps cultivate engaged, informed, and critical thinkers who are prepared to navigate an increasingly data-rich world.