Data interpretation Extra Challenge Worksheets for Ages 5-8
4 filtered results
-
From - To
Explore our engaging Data Interpretation Extra Challenge Worksheets designed for ages 5-8! These worksheets provide a fun and interactive way for young learners to enhance their data skills. Children will practice interpreting graphs, charts, and basic statistics while developing critical thinking and problem-solving abilities. Each worksheet is thoughtfully crafted to promote understanding of key concepts in a clear and accessible manner, ensuring that every child can grasp the essentials of data interpretation. Perfect for reinforcing classroom learning or serving as additional practice at home, these worksheets are a valuable resource for nurturing analytical skills in early education. Dive in and challenge your child today!

Reading Bar Graph Worksheet

Making a Graph: Creepy Crawlies Worksheet
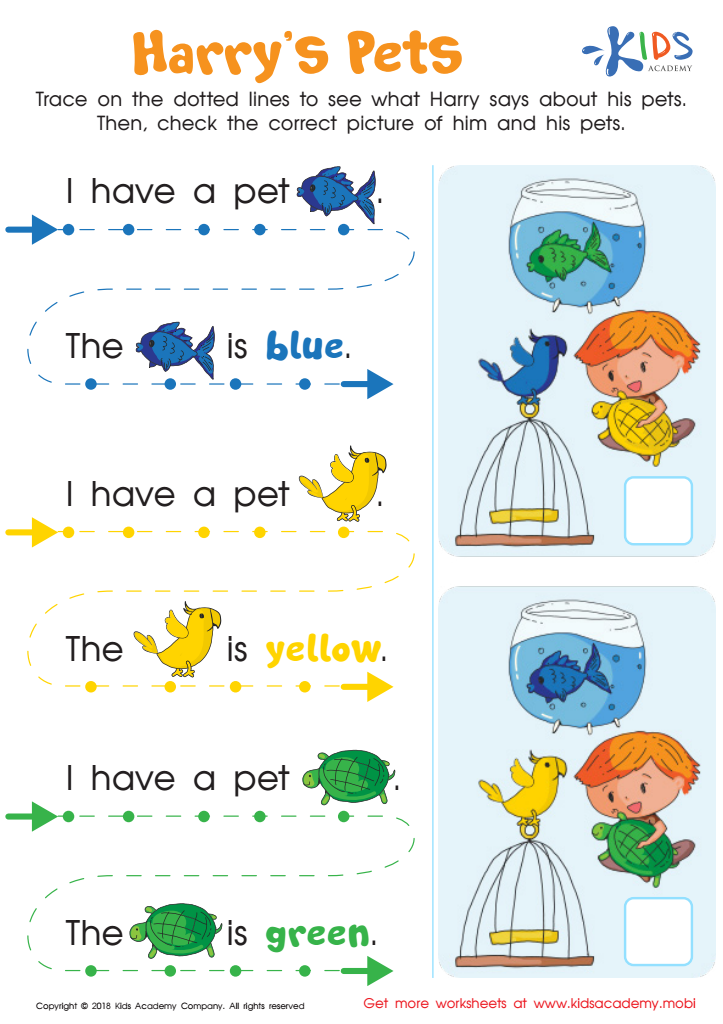
Read from Left to Right: Harry's Pets Worksheet

Leaf Measure Line Plot Worksheet


.jpg)
Data interpretation is a vital skill for children aged 5-8, making it essential for parents and teachers to emphasize its importance. At this early age, children begin to encounter various forms of data, whether through simple charts, graphs, or everyday situations. Understanding how to interpret data helps them make sense of the world around them.
By engaging in data interpretation, children learn to identify patterns, trends, and relationships. These foundational skills enhance their critical thinking and problem-solving abilities. For instance, when children compare numbers related to their favorite fruits or toys, they develop mathematical reasoning while also practicing analytical thinking. Skills acquired through data interpretation lay the groundwork for more complex subjects like math and science in later years.
Additionally, interpreting data fosters communication skills, empowering children to articulate insights and share findings with others. Parents and teachers can utilize diverse, engaging activities—such as games, stories, and hands-on experiences—to introduce data interpretation in a fun and relatable way.
Ultimately, nurturing these skills not only boosts academic performance but also prepares children for informed decision-making in everyday life, enriching their cognitive development and fostering lifelong learning habits.


