
Interpreting data Extra Challenge Worksheets for Ages 6-9
3 filtered results
Difficulty Level
Grade
Age
-
From - To
Subject
Activity
Standards
Unlock the joy of learning with our "Interpreting Data Extra Challenge Worksheets" designed for ages 6-9! These engaging worksheets encourage kids to explore and analyze data through fun activities, enhancing their critical thinking and problem-solving skills. Each thoughtfully crafted challenge aims to inspire young learners to interpret graphs, charts, and tables while enjoying math and science concepts. Perfect for classroom use or at-home practice, our worksheets provide a stimulating way to build essential analytical skills that lay the foundation for future success. Encourage your child's curiosity and analytical abilities with our interactive, extra challenge worksheets today!
Favorites
With answer key
Interactive

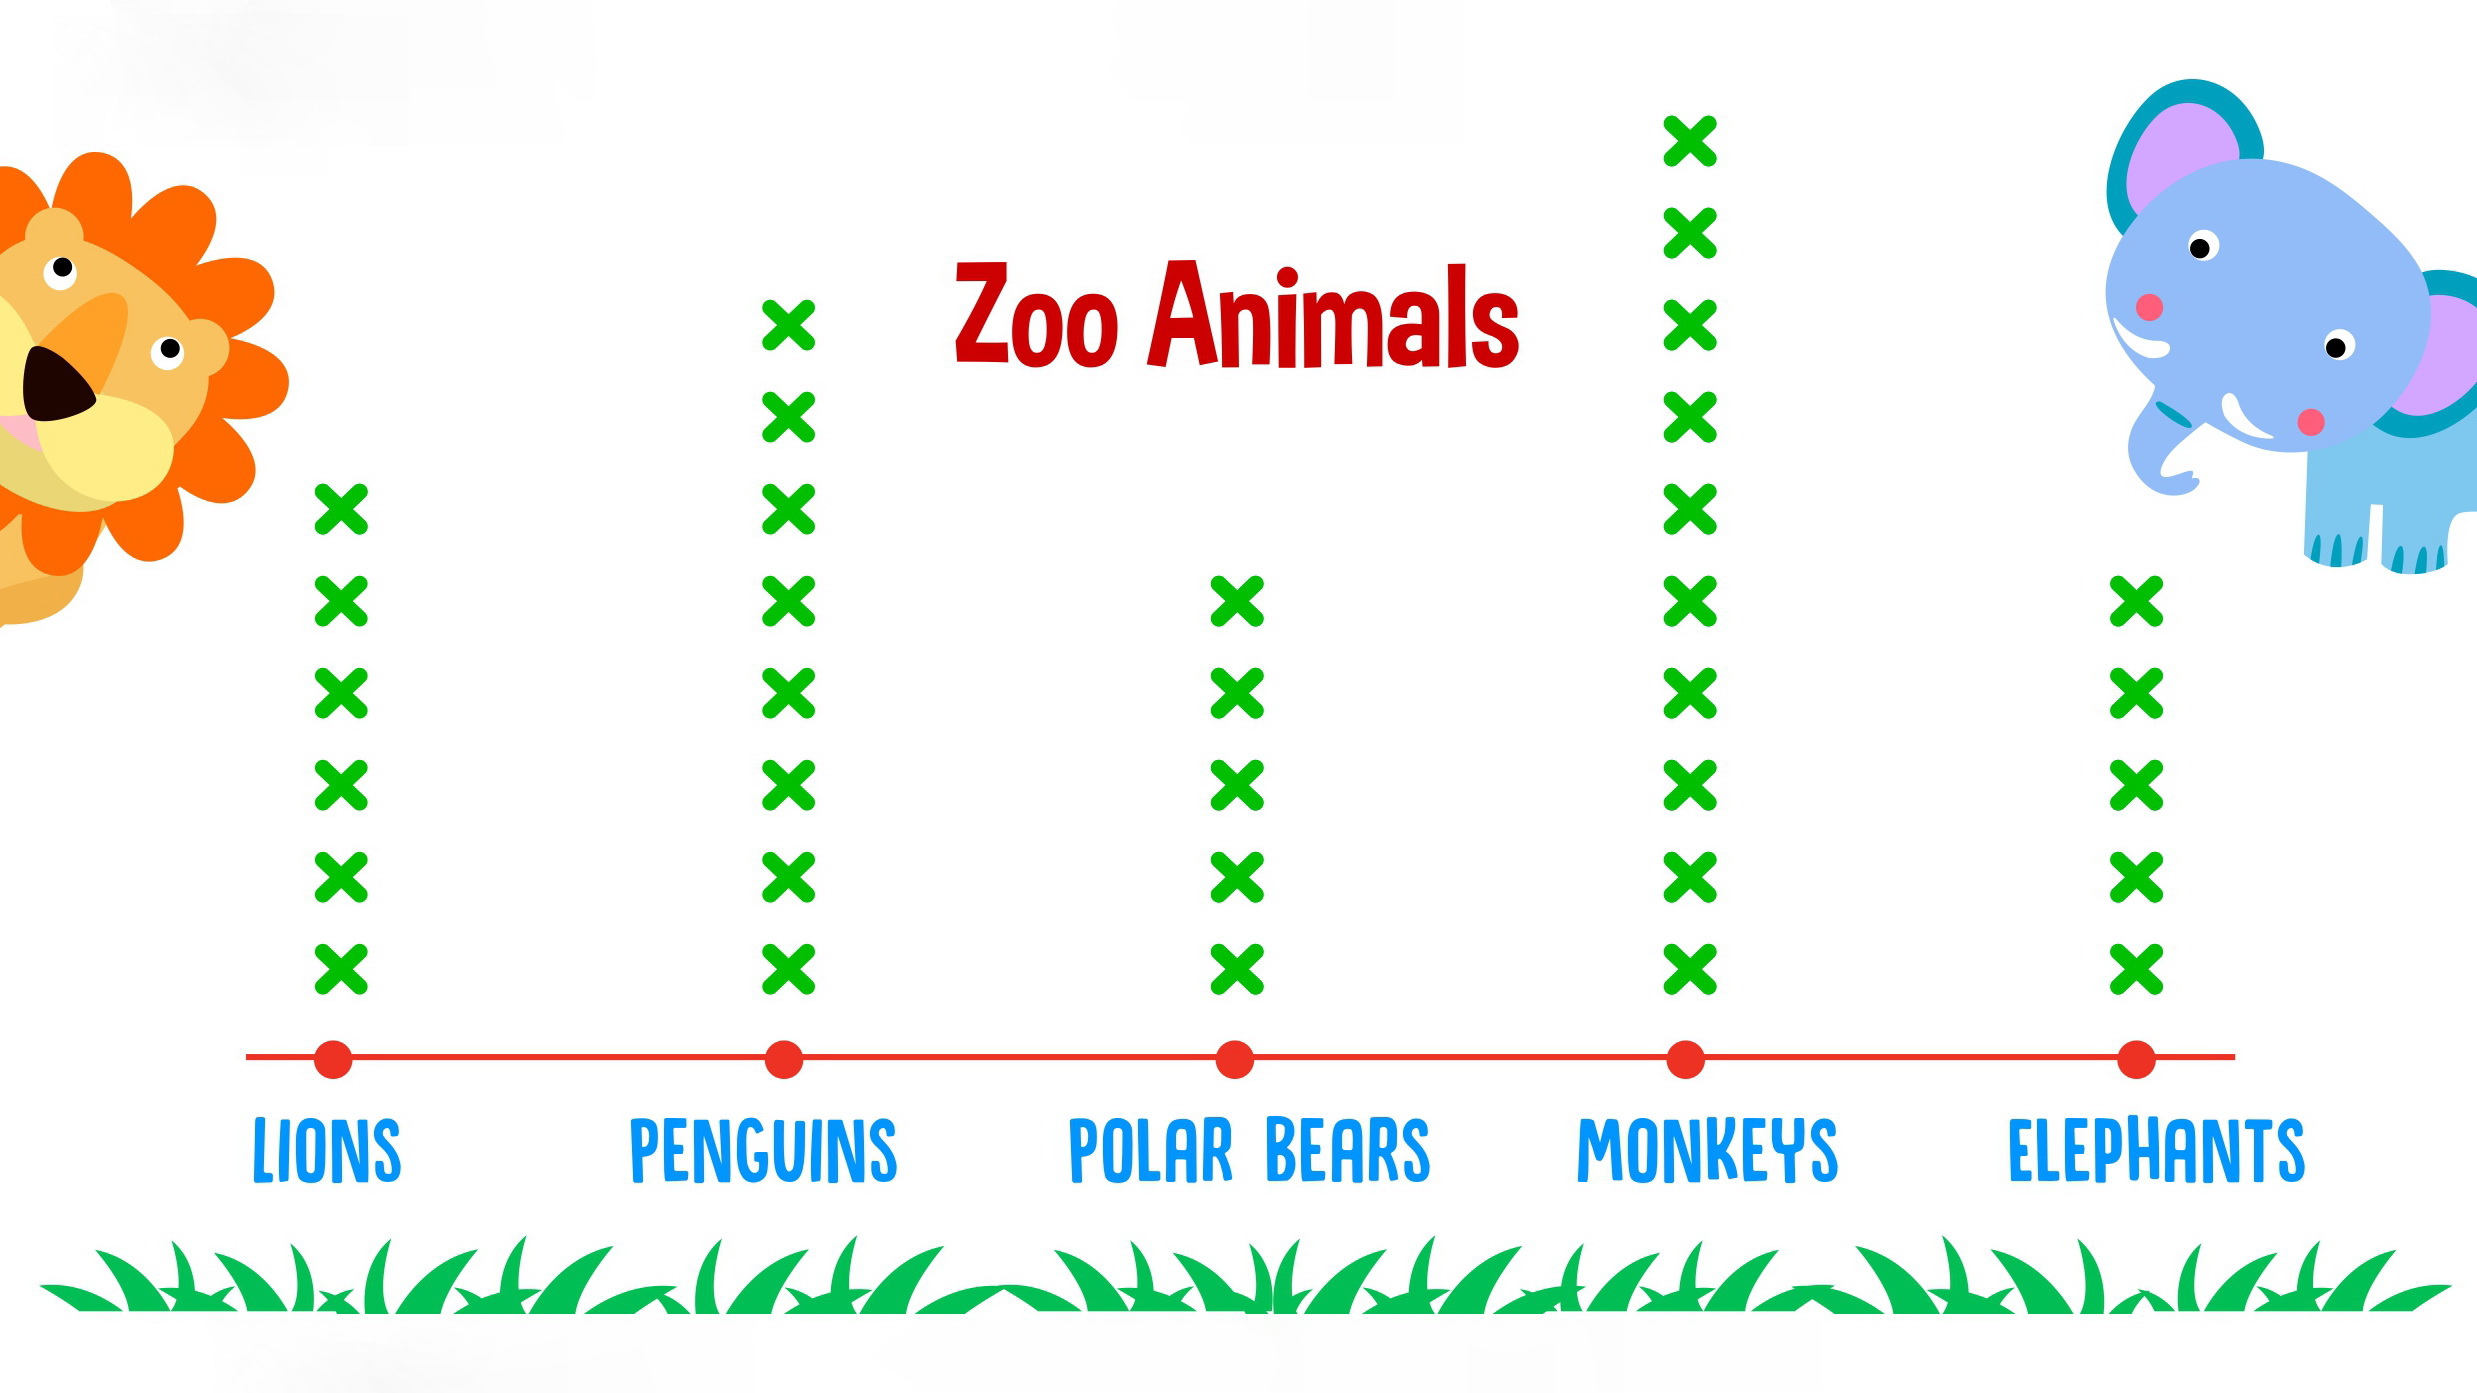
Interpret Line Plot Worksheet
Kids can learn to read graphs and analyze data easily with line plots. A fun zoo animal worksheet motivates kids to answer questions by reading the line plot and finding out how many animals a local zoo has.
Interpret Line Plot Worksheet
Worksheet

Leaf Bar Graph Worksheet
You can help your kids make learning easier and more enjoyable. While their teachers provide lessons and homework, you can take their education further. This worksheet can assist them in mastering bar charts. Count the leaves, then trace the correct line for each bar to complete the graph.
Leaf Bar Graph Worksheet
Worksheet

Match Tally Marks to Bar Graphs Worksheet
Learning math can be tough for kids. Rules and formulas can be confusing. Don't worry, this worksheet can help them understand graphs better. Show them how to match the tally marks with the graph that shows the same amount. It will help them grasp the basics and prepare them for more complex equations.
Match Tally Marks to Bar Graphs Worksheet
Worksheet
Join Kids Academy for Free
Who is primarily going to use this learning content?


Interpreting data is crucial for parents and teachers of children aged 6-9 because it plays a vital role in students' overall learning and development. At this age, kids are learning to make sense of the world around them. When parents and teachers engage with data, they can uncover important insights about a child's progress, strengths, and areas that might need improvement.
For instance, understanding test scores or classroom assessments can help identify patterns in a child's learning. Are they excelling in math but struggling with reading? This information enables adults to provide targeted support, such as extra tutoring or engaging activities that make literacy fun.
Moreover, interpreting data fosters critical thinking. When parents and teachers show children how to analyze simple data—like scores from games or their reading times—it encourages kids to ask questions, think analytically, and draw conclusions based on evidence.
Lastly, using data effectively can enhance communication between home and school, ensuring that everyone is on the same page regarding a child's education. By prioritizing data interpretation, parents and teachers can work together to create an enriching learning environment where children can thrive.


