Interpreting graphical information Worksheets for Kids
1 filtered results
Difficulty Level
Grade
Age
-
From - To
Subject
Activity
Standards
Interpreting graphical information worksheets are essential for enhancing learning and understanding visuals. They provide a structured approach to analyze graphs, charts, and diagrams, helping students decipher important data. Engaging with these exercises boosts critical thinking and analytical skills, and improves interpretation of complex graphics. Benefits include better data trend comprehension, improved problem-solving, and essential life skills like decision-making from visual data. These worksheets encourage interactive learning, fostering a deeper subject matter understanding. Consistent practice leads to proficiency in extracting information, comparing data sets, and drawing conclusions, thus aiding students in academics and real-world data analysis and decision-making tasks.
Favorites
With answer key
Interactive
How We Hear Sounds Worksheet
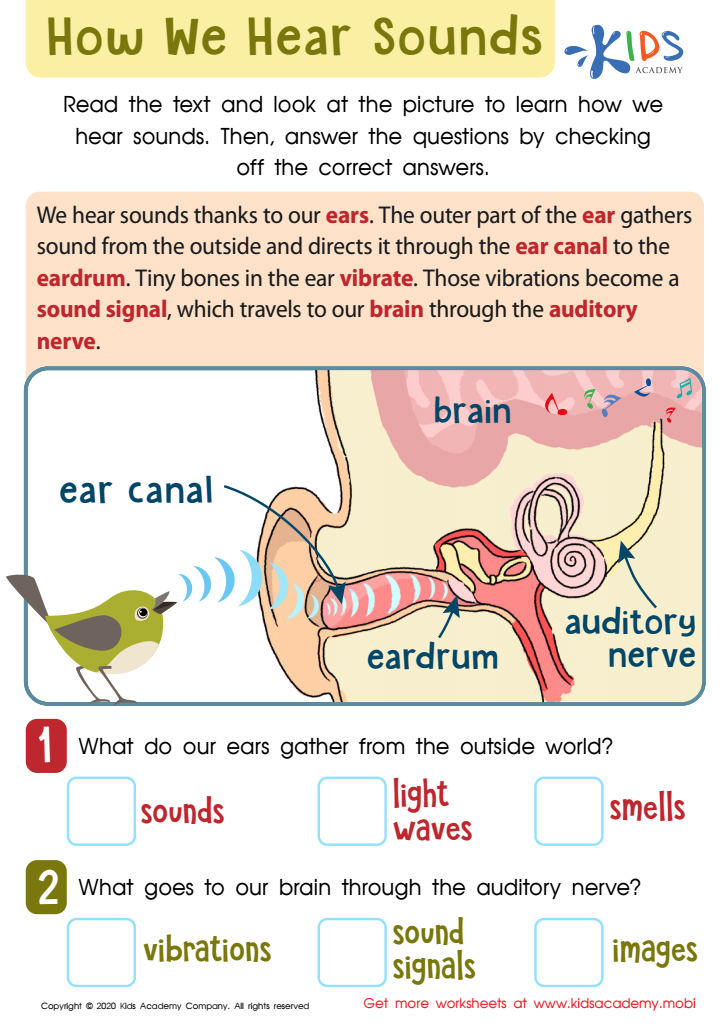
Before beginning this worksheet, make sure your students are aware of the five senses: sight, taste, touch, smell, and hearing. This worksheet will help them explore how we hear sounds with our ears. Read or listen to the text, study the images, and answer the questions. Check off the correct answers.
How We Hear Sounds Worksheet
Worksheet
Question/Answer
How to train the Interpreting graphical information skill in Grade 1 students learning about Physical Science?
To train Grade 1 students in interpreting graphical information in Physical Science, start with simple, colorful charts or picture graphs related to everyday physical phenomena (like weather, states of matter, or simple machines).
How does the mastery of the Interpreting graphical information skill affect a student's performance at an early age?
Mastery of interpreting graphical information at an early age significantly enhances a student's performance by improving their ability to analyze, synthesize, and derive meaningful insights from various data representations. This skill fosters critical thinking, supports mathematical and scientific understanding, and promotes better problem-solving abilities, thus laying a solid foundation for academic success across multiple disciplines.
How to test a Grade 1 student’s Interpreting graphical information skills?
To test a Grade 1 student's interpreting graphical information skills, provide them with simple graphs or pictographs that use familiar objects or themes. Ask them to answer basic questions about the data represented, such as counting items, identifying which category has more or less, and simple addition or subtraction based on the graph.
Join Kids Academy for Free
Who is primarily going to use this learning content?