Graphs Worksheets for Ages 4-6
8 filtered results
-
From - To
Discover engaging and educational graphs worksheets for children aged 4-6! Our carefully curated resources introduce young learners to the basics of graphs in a fun and interactive way. These worksheets help develop essential early math skills, such as data recognition, comparison, and interpretation through colorful illustrations and simple activities. Perfect for classroom use or at home, our worksheets foster a love for learning while building a strong foundation in mathematical concepts. Let your little ones explore the world of graphs with confidence, enhancing their critical thinking and problem-solving abilities. Start their educational journey today with our exciting graph worksheets!
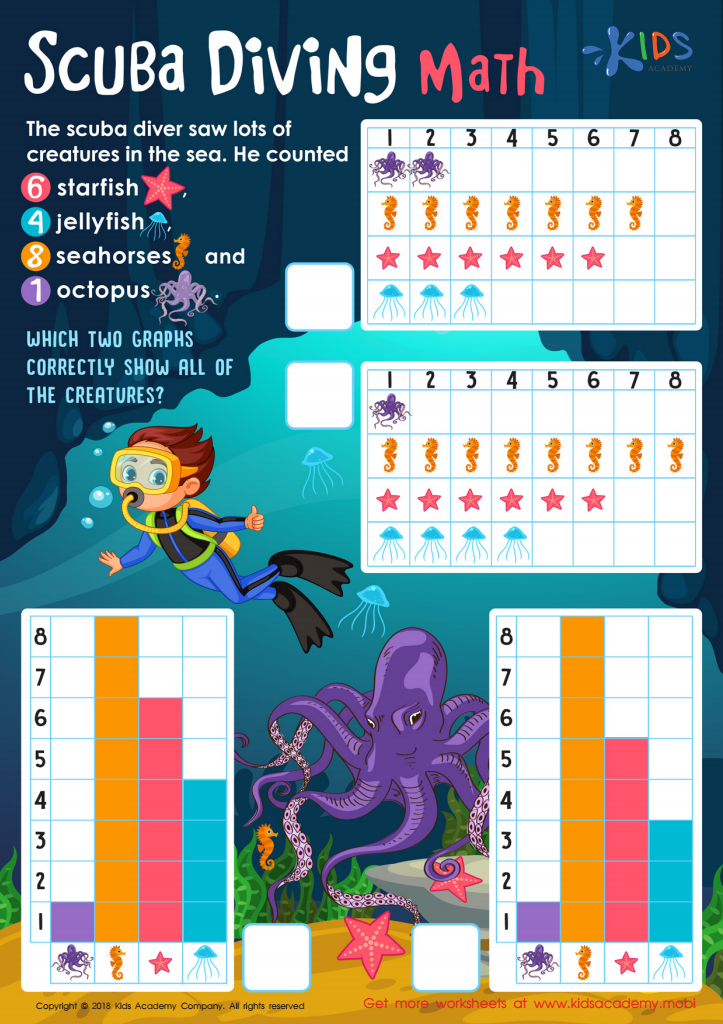
Scuba Diving Math Worksheet
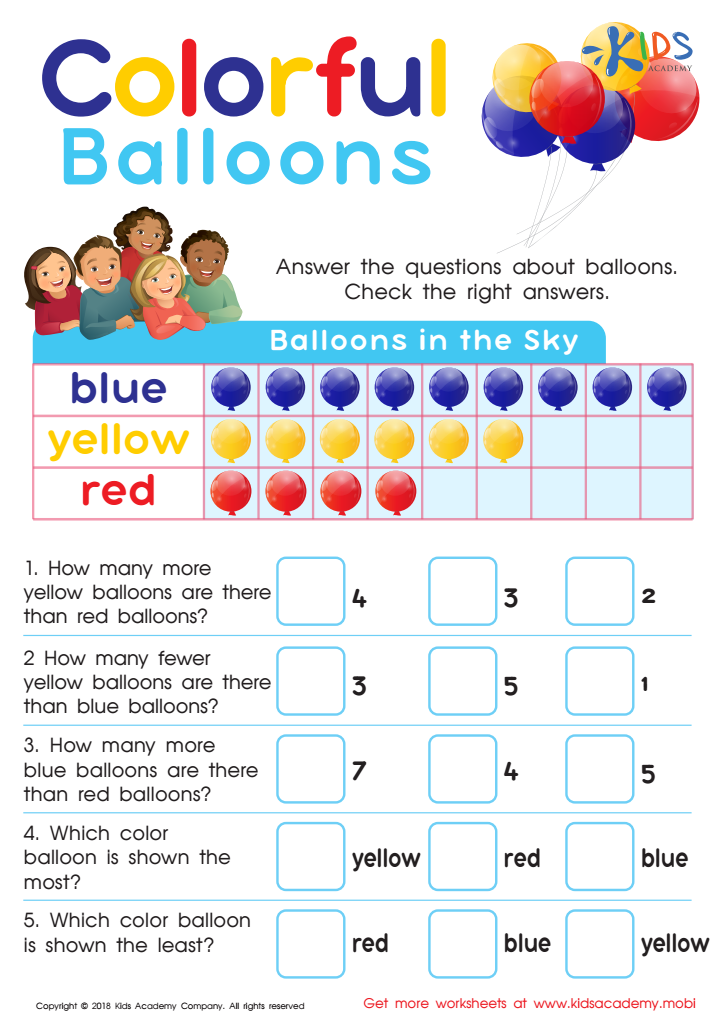
Picture Graphs: Colorful Balloons Worksheet
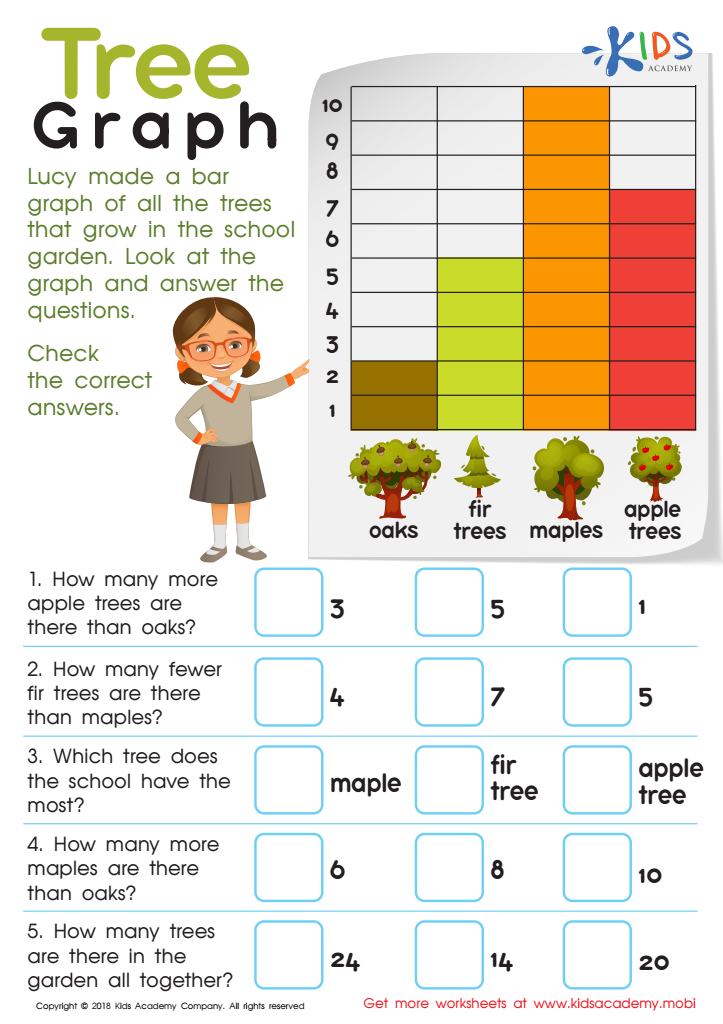
Tree Graph Worksheet
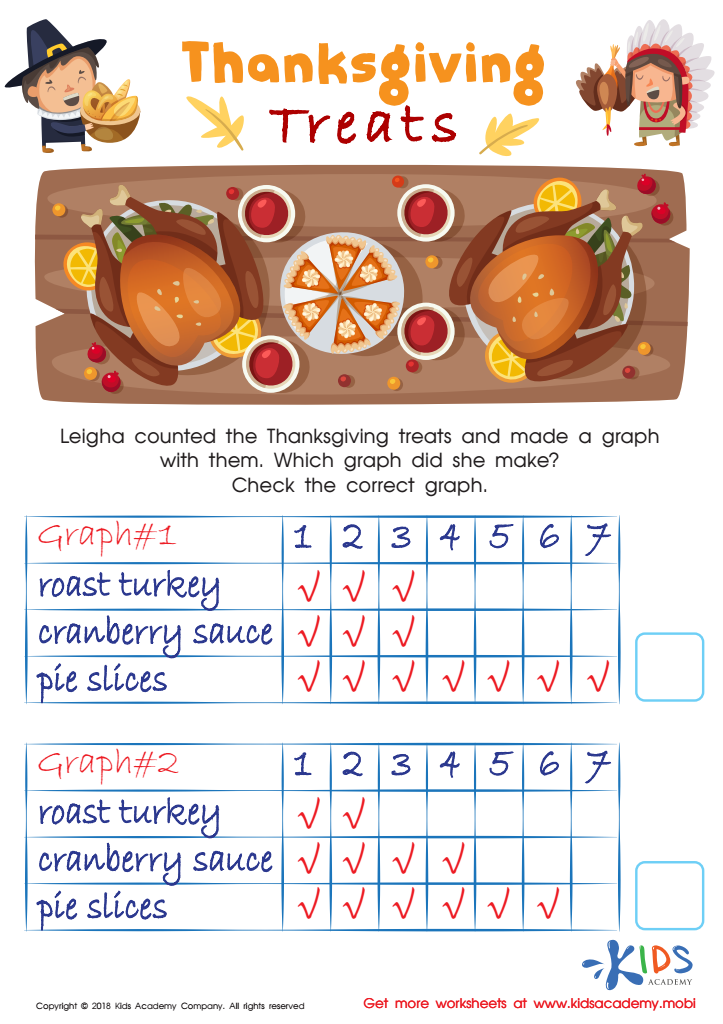
Graphs: Thanksgiving Treats Worksheet
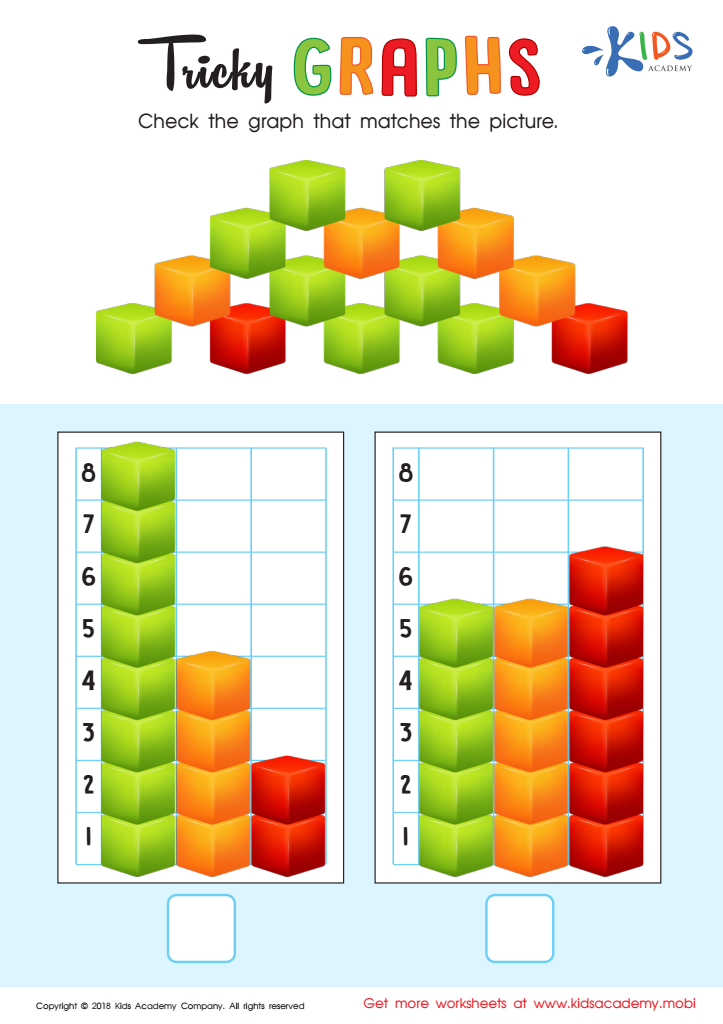
Tricky Graphs Worksheet

Match Tally Marks to Bar Graphs Worksheet

Graph: Baby Animals Worksheet
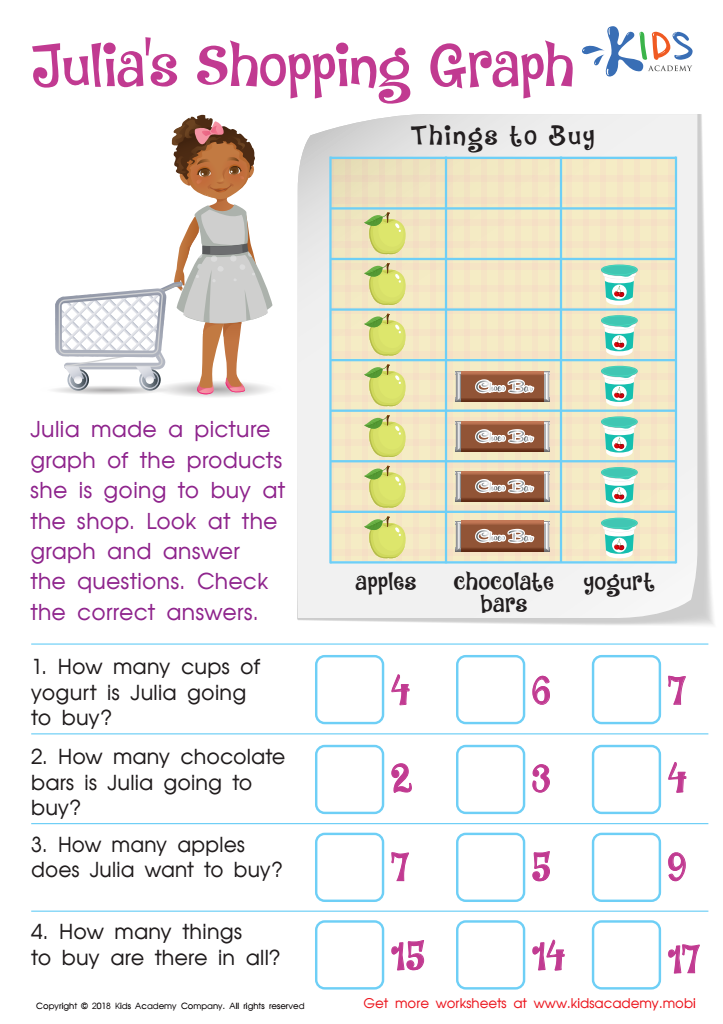
Julia's Shopping Graph Worksheet


Graphs are essential tools for understanding and interpreting information, making them important for parents and teachers of young children aged 4-6. At this early developmental stage, children are naturally curious and eager to explore their environment. Introducing them to graphs cultivates critical thinking skills and helps them make sense of the world around them.
By engaging with graphs, young learners develop early numeracy skills, such as counting, comparing quantities, and recognizing patterns. Graphs simplify complex information, allowing children to visualize data in a clear and engaging way. For example, a simple bar graph showing favorite fruits can spark discussions about preferences, encouraging communication and social interaction among peers.
Additionally, learning to read and create graphs fosters problem-solving skills—essential for lifelong learning. As children begin to grasp these concepts, they build a foundation for future studies in mathematics and science.
Furthermore, involving parents in graphing activities enhances the home learning environment, making math fun and relatable. Ultimately, understanding graphs equips young learners with vital skills that promote analytical thinking, communication, and collaboration. Therefore, parents and teachers should prioritize graphing in early education, emphasizing its value in developing essential competencies in young children.


