Understanding graphs Math Worksheets for Ages 6-8
6 filtered results
-
From - To
Discover our "Understanding Graphs Math Worksheets" designed specifically for children aged 6-8. These engaging worksheets introduce young learners to the fundamental concepts of graphs, including bar graphs, pictographs, and line graphs. Through colorful visuals and interactive exercises, kids will develop essential skills such as data interpretation and comparison. Each worksheet is crafted to enhance critical thinking and problem-solving abilities, making math fun and accessible. Ideal for both at-home learning and classroom use, these resources empower your child to grasp graphing concepts confidently and enjoyably. Start building a strong mathematical foundation today with our delightful graph understanding worksheets!

Recycling Picture Graph Worksheet

Making a Graph: Creepy Crawlies Worksheet

Fruit Math: Picture Graphs Worksheet
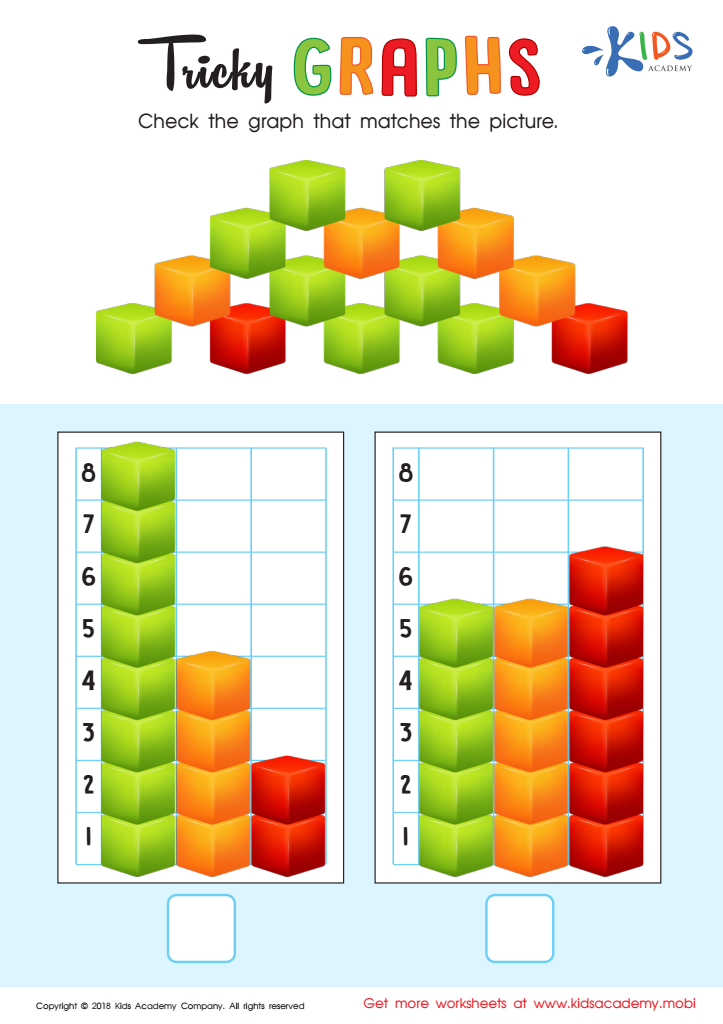
Tricky Graphs Worksheet

Match Tally Marks to Bar Graphs Worksheet

Aircraft Carrier Picture Graphs Worksheet


Parents and teachers should care about understanding graphs for children aged 6-8 because this foundational skill fosters critical thinking and enhances mathematical literacy. At this age, children are beginning to make sense of visual information, and grappling with graphs introduces them to important concepts in data interpretation, comparison, and representation.
Engaging with graphs encourages young learners to analyze trends and recognize relationships, skills that are transferable to real-world scenarios beyond math class. By learning to read and create simple bar graphs, pictographs, and line graphs, children gain the ability to interpret data related to their everyday experiences—such as survey results about their favorite animals or classroom attendance—which makes learning more relevant and enjoyable.
Furthermore, understanding graphs supports stronger communication skills, as children learn to articulate what the data represents and draw conclusions based on visual information. This capability nurtures confidence in handling quantitative information, which is critical for future academic success.
In summary, teaching children how to understand graphs equips them with lifelong skills in critical thinking, data literacy, and effective communication, laying the groundwork for informed, engaged citizenship in a data-driven world.


