Analyzing data Graphs Worksheets for 8-Year-Olds
4 filtered results
-
From - To
Unlock your child's analytical potential with our "Analyzing Data Graphs Worksheets for 8-Year-Olds". These engaging activities are designed to help young learners interpret and understand data through interactive graph analysis. Our worksheets cover various graph types, including bar graphs, pictograms, and line plots, making math fun and accessible. Perfect for third graders, each exercise encourages critical thinking, data interpretation, and problem-solving skills. Equip your child with the tools they need to excel in math while boosting their confidence in interpreting real-world data. Dive into our thoughtfully crafted worksheets and make data analysis an enjoyable learning adventure!

Recycling Picture Graph Worksheet

Planets Bar Graph Worksheet
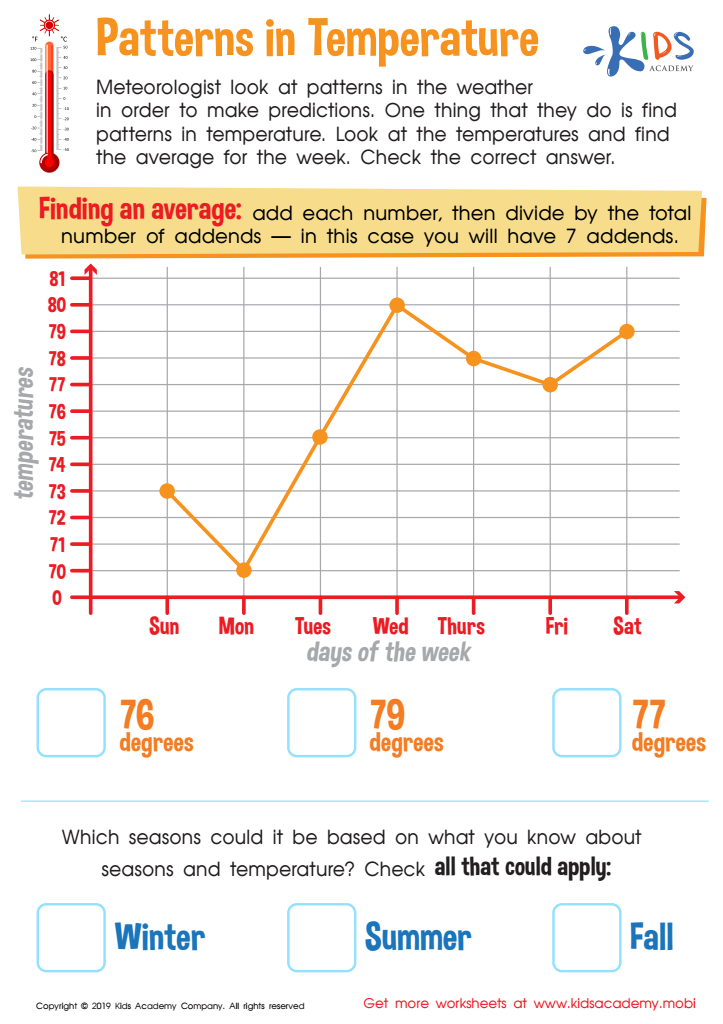
Patterns in Temperature Worksheet

Egyptian Bar Graph Worksheet


Analyzing data graphs is a fundamental skill that benefits 8-year-olds in numerous tangible ways, setting a robust foundation for their future academic and personal success. For parents and teachers, cultivating this ability early means empowering children with the tools to interpret information critically and make informed decisions. Data graphs simplify complex information into more digestible visual formats, facilitating easier comprehension for young minds. When children learn to understand and draw insights from graphs, they're not only demystifying math concepts but also honing their ability to observe patterns, trends, and relationships between variables.
Moreover, proficiency in graph analysis boosts a child's logical reasoning and problem-solving skills. These are essential across subjects, enhancing their capacity to tackle challenges in science experiments, social studies projects, and even daily life occurrences. For example, understanding weather patterns through line graphs can make a planetary science lesson more engaging and relatable.
In the real world, we're inundated with data — from news infographics to personal health charts. By learning these skills early on, children become adept at interpreting various forms of data presentations they'll encounter throughout their lives, fostering an informed and competent future generation. For parents and teachers, focusing on this skill is an investment in the child's intellectual growth and adaptability in an increasingly data-driven world.


