
Interpreting data Math Worksheets for 9-Year-Olds
3 filtered results
Difficulty Level
Grade
Age
-
From - To
Subject
Activity
Standards
Discover engaging "Interpreting Data" math worksheets specially designed for 9-year-olds! Our collection helps young learners develop essential skills in analyzing and interpreting data from various sources, such as graphs, charts, and tables. These worksheets encourage critical thinking while making math fun and interactive. Each activity is aligned with age-appropriate curriculum standards, ensuring children learn to visualize and convey information accurately. By practicing these worksheets, students will gain confidence in their ability to make data-driven decisions and understand real-world applications of math. Perfect for both classroom and home learning, our worksheets make mastering data interpretation an enjoyable experience!
Favorites
With answer key
Interactive
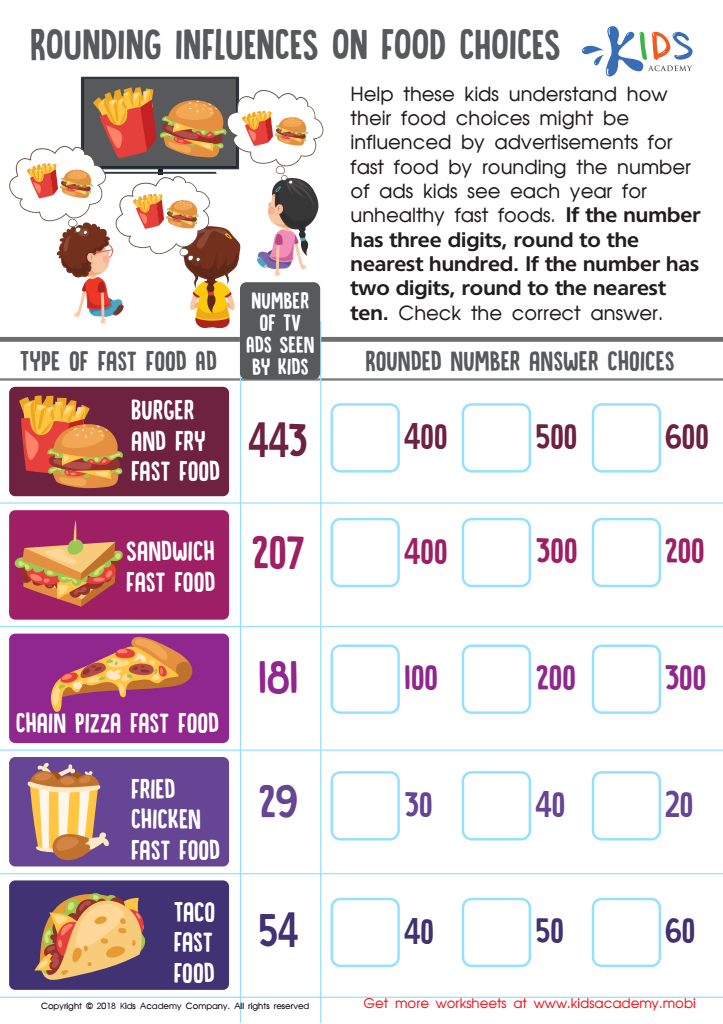
Rounding Influences Food Choices Worksheet
Kids find math more enjoyable when it reflects real-life scenarios. This free worksheet combines math and health! Kids view data on the number of ads they're exposed to in a year and must round the numbers to the nearest ten or hundred. Solve and check the correct answers to finish.
Rounding Influences Food Choices Worksheet
Worksheet

Interpret Line Plot Worksheet
Kids can learn to read graphs and analyze data easily with line plots. A fun zoo animal worksheet motivates kids to answer questions by reading the line plot and finding out how many animals a local zoo has.
Interpret Line Plot Worksheet
Worksheet

Leaf Bar Graph Worksheet
You can help your kids make learning easier and more enjoyable. While their teachers provide lessons and homework, you can take their education further. This worksheet can assist them in mastering bar charts. Count the leaves, then trace the correct line for each bar to complete the graph.
Leaf Bar Graph Worksheet
Worksheet
Join Kids Academy for Free
Who is primarily going to use this learning content?


Interpreting data is a crucial skill for 9-year-olds as it lays the foundation for critical thinking, problem-solving, and informed decision-making. Parents and teachers should care about this skill because data interpretation goes beyond numbers; it empowers children to understand and analyze the world around them.
At this age, children's cognitive abilities are rapidly developing, allowing them to grasp concepts such as patterns, trends, and statistical relevance. When they learn to interpret data, they cultivate skills such as analytical thinking, which fosters confidence in their ability to engage with real-life situations, from interpreting weather reports to making sense of sports statistics.
Moreover, in our increasingly data-driven world, being able to understand, interpret, and communicate data positions children for future academic and career success. Mastering this skill can also enhance their math proficiency, as it integrates various mathematical concepts like averages, graphs, and proportions in a practical context.
Engaging children in data interpretation can make learning more dynamic and interactive, turning abstract concepts into tangible experiences. Therefore, investing time and effort in teaching kids these skills is critical for their holistic development and preparedness for higher-level mathematics and everyday life challenges.


