Graphs Worksheets for Ages 7-9 - Page 2
27 filtered results
-
From - To
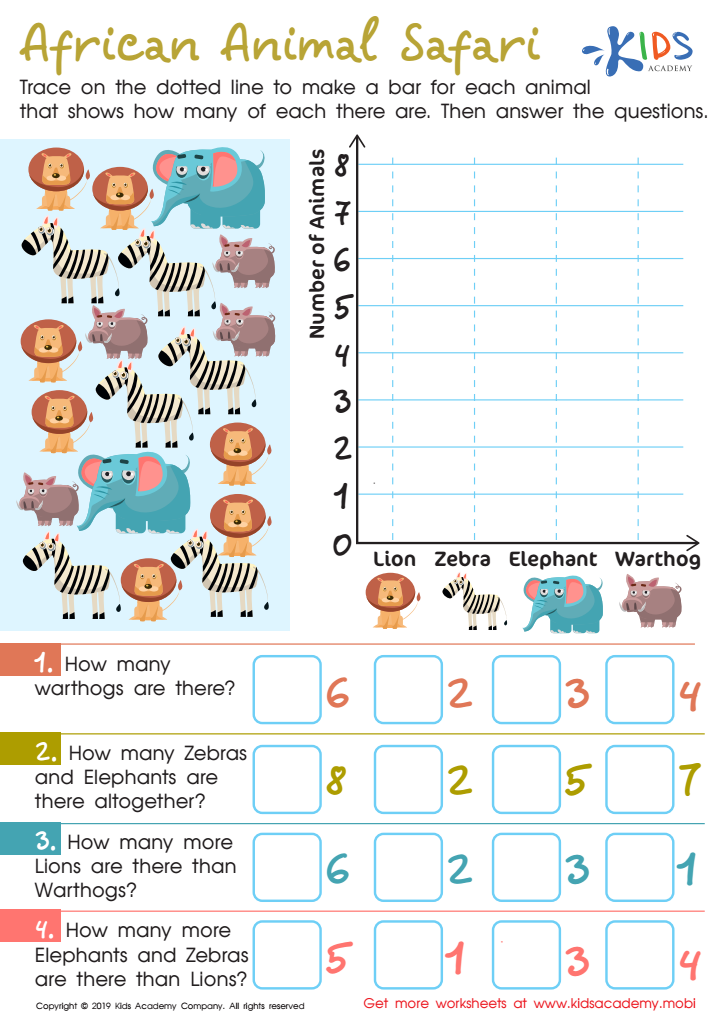
African Animal Safari Worksheet

Leaf Measure Line Plot Worksheet

Football Math Worksheet


Parents and teachers should recognize the importance of introducing graphs to children aged 7-9 as it lays a critical foundation for both their mathematical understanding and practical problem-solving skills. Graphs offer a visual representation of data, making it easier for young learners to grasp complex ideas by presenting them in simpler, more digestible formats. This age is ideal for introducing basic graph types such as bar charts, line graphs, and pie charts.
Firstly, grappling with graphical data enhances numeracy and critical thinking skills. Children learn to interpret patterns, trends, and deviations, which sharpens their analytical abilities. Secondly, graphs provide a practical context for applying arithmetic operations, such as counting, addition, and subtraction, fostering a more engaging and hands-on experience with math.
Thirdly, early familiarity with graphs cultivates data literacy, a key competency in an increasingly data-driven world. Understanding how to read and create graphs prepares children for advanced STEM subjects, setting them up for future academic success.
Finally, incorporating graphs into lessons can also make learning more fun and interactive. Children can collect data from their own experiences or surroundings, such as favorite fruits or daily temperatures, and then convert that data into graphs. This adds relevance and makes learning more personalized and enjoyable. Overall, introducing graphs to young learners is a crucial step in developing essential life skills.


