Normal Graphs Worksheets for Ages 6-8
4 filtered results
-
From - To
Discover engaging and educational Normal Graphs Worksheets designed for children aged 6 to 8. Our carefully crafted resources introduce young learners to the fundamentals of graphing in a fun and interactive way. Each worksheet features vibrant visuals and easy-to-follow instructions, helping students grasp essential concepts like plotting points, interpreting data, and understanding basic graph types. Perfect for both classroom activities and home learning, these worksheets encourage critical thinking and enhance math skills. Download and print these printable graphs worksheets to provide your child with valuable practice and inspire a love for math and problem-solving from an early age!

Graph: Baby Animals Worksheet
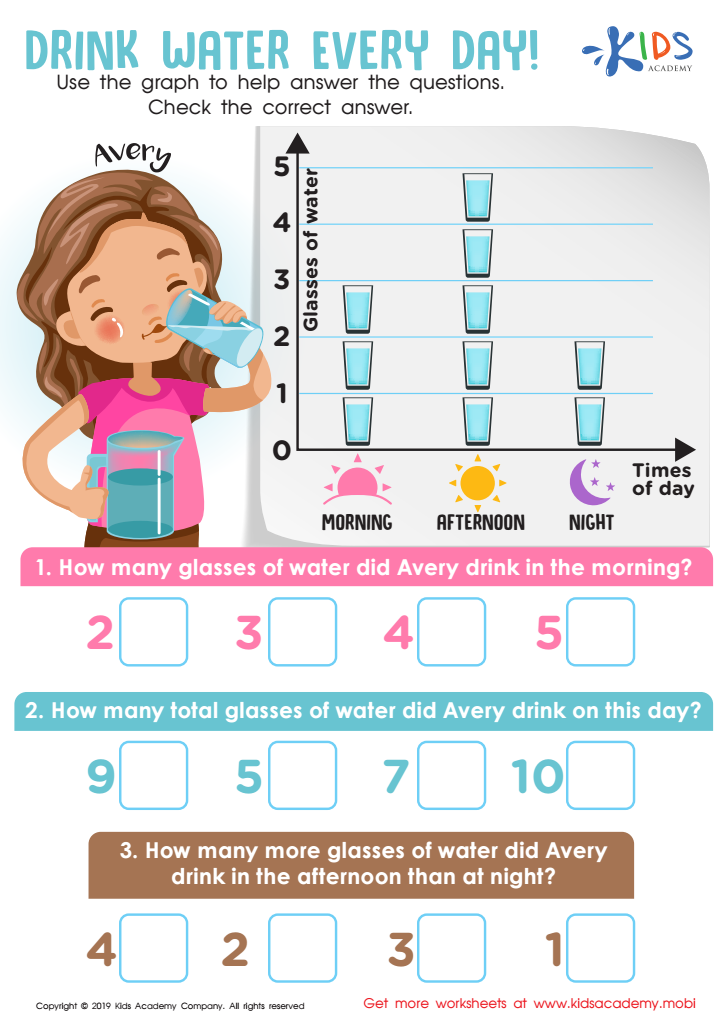
Drink Water Every Day! Worksheet
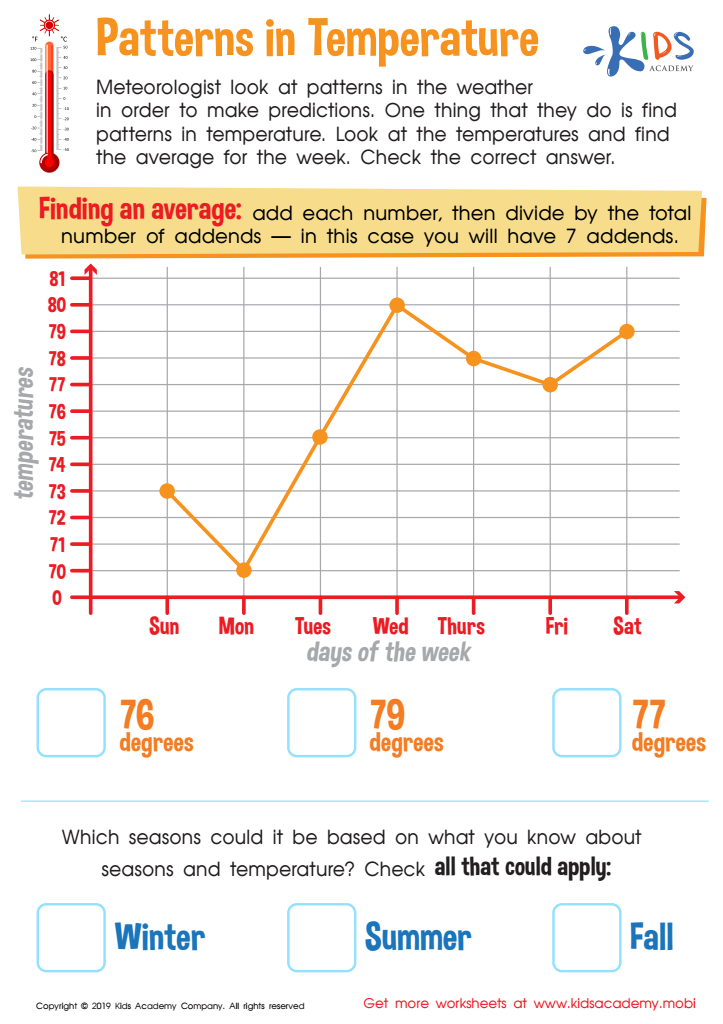
Patterns in Temperature Worksheet
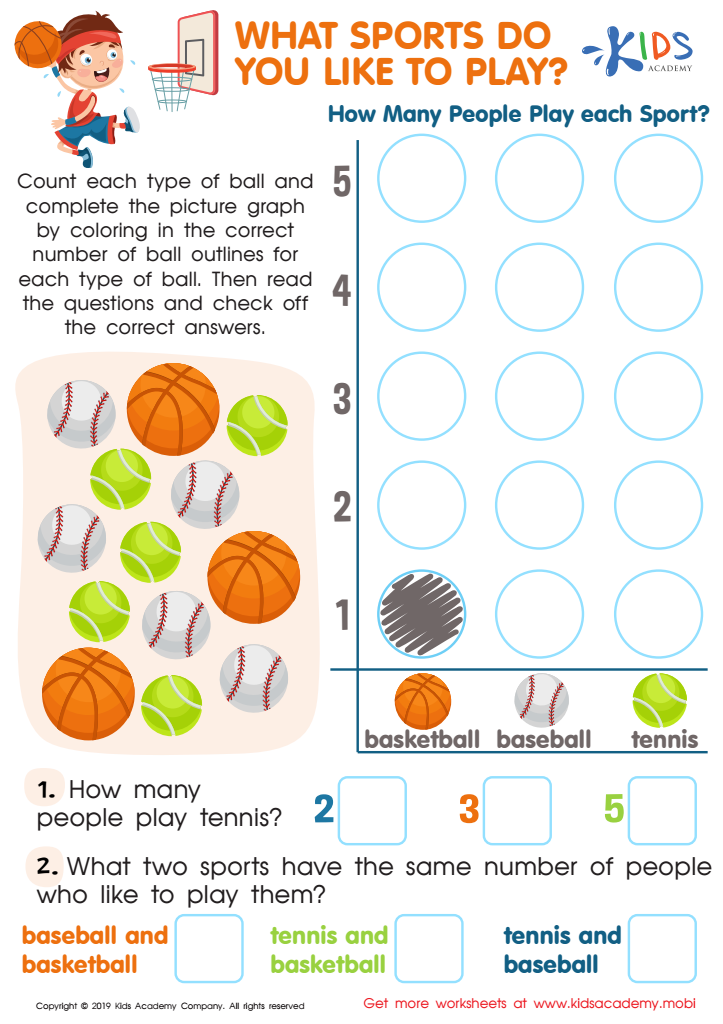
What Sports Do You Like to Play Worksheet


Normal graphs, also known as bar graphs or tally charts, are essential tools for children aged 6-8 as they begin to understand basic data representation and interpretation. Parents and teachers should care about normal graphs because they lay the foundation for mathematical literacy and critical thinking. At this age, children are naturally curious and eager to learn about their world, and normal graphs help them learn how to organize, represent, and make sense of information and data in a visual format.
Using normal graphs, children can learn to compare quantities, identify trends, and make informed predictions, essential skills in both everyday life and future academic pursuits. Moreover, visualizing data encourages engagement and helps foster problem-solving skills. By incorporating normal graphs into learning activities, educators and parents can create rich, interactive experiences that enhance children's comprehension and retention of information.
Incorporating graphing activities also supports the development of language skills as children learn to describe their findings and orally communicate their interpretations. Overall, normal graphs empower young learners, enhancing their ability to analyze and understand the world around them while building a strong mathematical foundation for the future.