Normal Graphs Worksheets for Ages 6-9
4 filtered results
-
From - To
Explore our engaging "Normal Graphs Worksheets" designed specifically for children ages 6-9! These printable resources help young learners develop essential graphing skills while having fun. Our worksheets encourage students to interpret data, understand coordinate systems, and create their own graphs. Tailored to align with early math curricula, each worksheet features colorful visuals and age-appropriate tasks that make learning how to read and construct graphs enjoyable. Perfect for teachers and parents alike, our worksheets provide a comprehensive approach to mastering basic graphing concepts, fostering critical thinking, and building a solid foundation in mathematics. Start enhancing your child's math skills today!

Graph: Baby Animals Worksheet
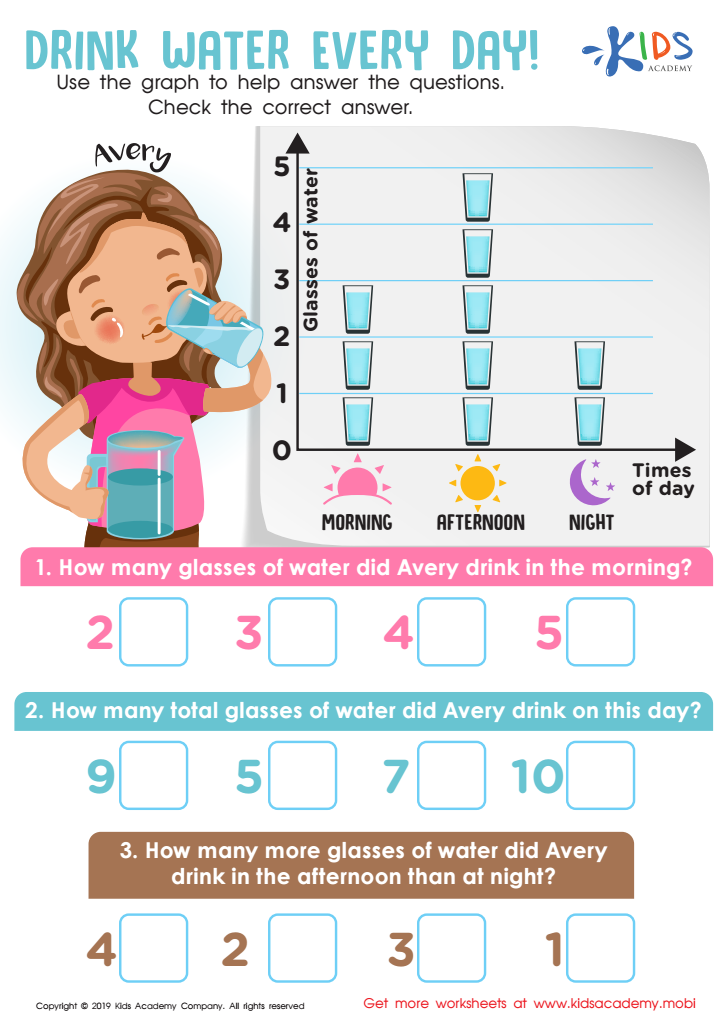
Drink Water Every Day! Worksheet
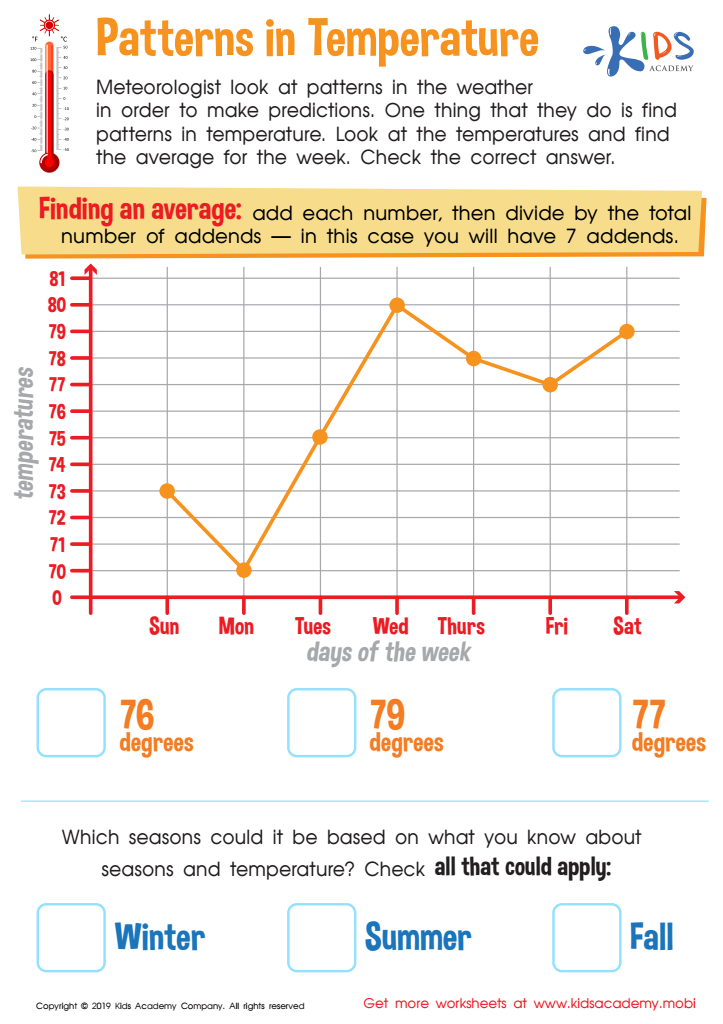
Patterns in Temperature Worksheet
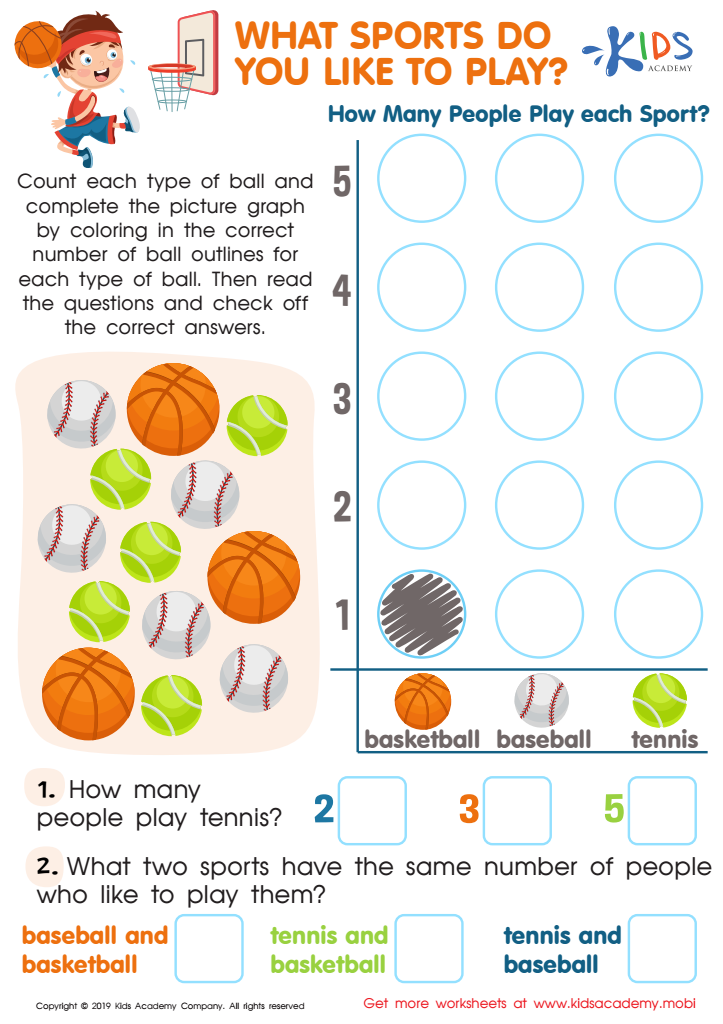
What Sports Do You Like to Play Worksheet


Understanding Normal Graphs is essential for parents and teachers of children aged 6-9 because they provide a clear visual representation of data, helping young learners grasp fundamental concepts of mathematics and statistics in a relatable way. These graphs simplify complex information and facilitate engagement, making it easier for children to compare, analyze, and interpret data as they begin to explore the basics of graphing.
Normal Graphs introduce children to the idea of distribution—how data can be grouped and represented visually. This foundational knowledge fosters critical thinking and enhances problem-solving skills, as students learn to organize information logically. Incorporating Normal Graphs into lessons can also create opportunities for interdisciplinary learning, where math meets art and science, and can be used in real-world contexts, such as sorting classroom supplies or tracking growth over time.
Moreover, visual aids like Normal Graphs appeal to various learning styles, ensuring no child feels left behind. By teaching children to read and create Normal Graphs, parents and educators can help them build confidence in their mathematical abilities, preparing them for more advanced concepts in the future. Thus, embracing Normal Graphs is a valuable step towards nurturing mathematically literate and capable individuals.