Interpreting data Easy Worksheets for Ages 6-9
3 filtered results
Difficulty Level
Grade
Age
-
From - To
Subject
Activity
Standards
Welcome to our "Interpreting Data Easy Worksheets" page for ages 6-9! Our collection features engaging activities designed to help young learners understand and analyze data in a fun and interactive way. Each worksheet encourages kids to explore concepts such as charts, graphs, and tables while developing critical thinking skills. These resources align with educational standards, ensuring that your child builds a strong foundation in data interpretation. Whether you're a teacher or a parent, our easy-to-use printables make learning enjoyable and effective. Discover the joy of mastering data interpretation with our thoughtfully crafted worksheets today!
Favorites
With answer key
Interactive

Pencil Case Line Plot Worksheet
Explain to your child that a line plot is a way to organize information. For example, if they need to arrange objects, they should draw a line plot. Now, have them help Tom measure the objects in his pencil case in inches. Then, have them check the line plot that accurately shows the length.
Pencil Case Line Plot Worksheet
Worksheet
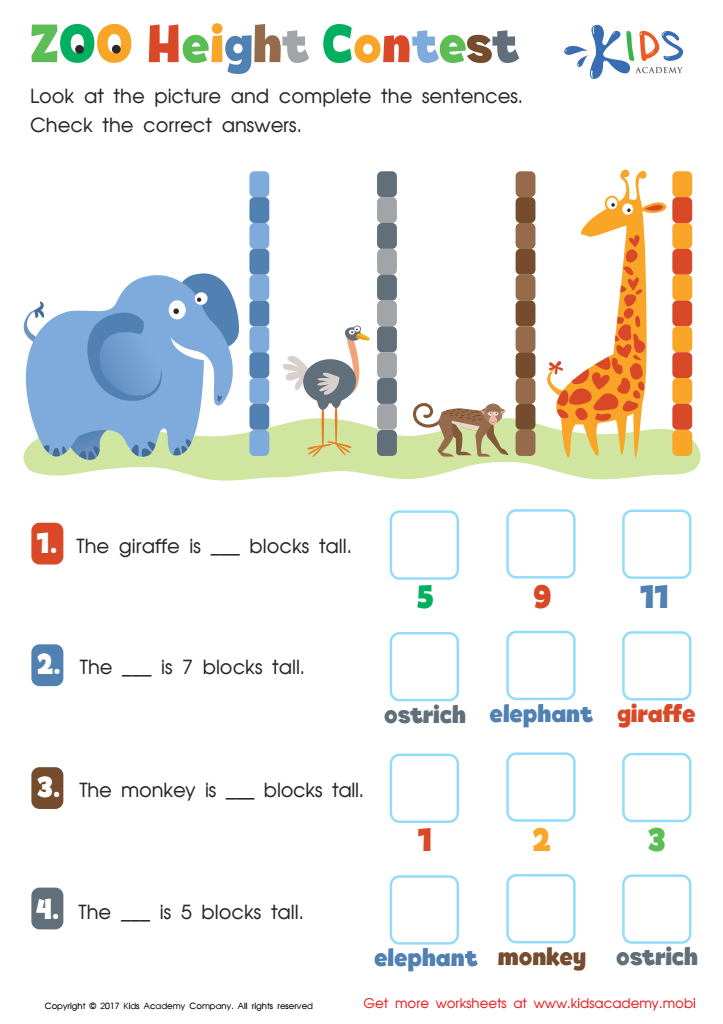
Zoo Height Contest Worksheet
Let's head to the zoo and use colorful blocks to measure your child's favorite animals! With this Kids Academy worksheet, help them practice and prepare for learning measurement. Guide them in looking at the zoo animals and counting blocks to find the height. Then, read the questions and check the box next to the correct answer.
Zoo Height Contest Worksheet
Worksheet

Family Line Plot Worksheet
Have you and your kids ever done a family height measurement? How did it go? If they're familiar with it, this worksheet may be simpler. The picture shows a family with their heights recorded. Get your kid to look at the line plots and choose the one that shows the family's heights accurately.
Family Line Plot Worksheet
Worksheet
Join Kids Academy for Free
Who is primarily going to use this learning content?


Interpreting data is super important for both parents and teachers when it comes to helping kids ages 6-9. First, it helps them see how children are learning and what they understand. For example, if a teacher tracks how well students can add and subtract, they can find out who might need a little extra help or who is ready for harder challenges. This way, every child can learn in a way that suits them best!
Also, parents can understand how their kids are doing in school by looking at simple data like grades, attendance, and even the types of activities their kids enjoy. When parents and teachers work together using this data, they can create a strong support system.
Additionally, learning how to understand data teaches kids important skills. It shows them how to make decisions based on information, which is a skill they will use throughout their lives. It’s like a treasure map that leads to better learning outcomes! In short, by caring about interpreting data, parents and teachers can help children grow and succeed, making learning both fun and effective!