Data interpretation Easy Math Worksheets for Ages 7-8
10 filtered results
Difficulty Level
Grade
Age
-
From - To
Subject
Activity
Standards
Welcome to our "Data Interpretation Easy Math Worksheets" designed specifically for children ages 7 to 8! These engaging worksheets are perfect for helping young learners develop essential math skills through practical data analysis. With a variety of fun activities, your child will learn to read graphs, interpret charts, and understand basic statistics. Each worksheet is carefully crafted to promote understanding and confidence in math while keeping the learning experience enjoyable. Ideal for classroom use or home practice, our worksheets align with educational standards and provide your child with the skills they need to excel. Explore the fun world of data interpretation today!
Favorites
With answer key
Interactive

Fruit Math: Picture Graphs Worksheet
Help your child learn to draw graphs by having them look at pictures. Ask them to identify a graph that accurately portrays the data and have them explain why. This will prepare them to easily draw more complex graphs in the future. For example, have them look at the picture with the number of fruits in the colorful worksheet and explain why the graph is accurate.
Fruit Math: Picture Graphs Worksheet
Worksheet

Students Line Plot Worksheet
Help your students learn to draw a line plot correctly by giving real examples. In this exercise, they must check the data of a class of 18 students' heights (in inches). Have them compare two line plots and figure out which one is correct.
Students Line Plot Worksheet
Worksheet
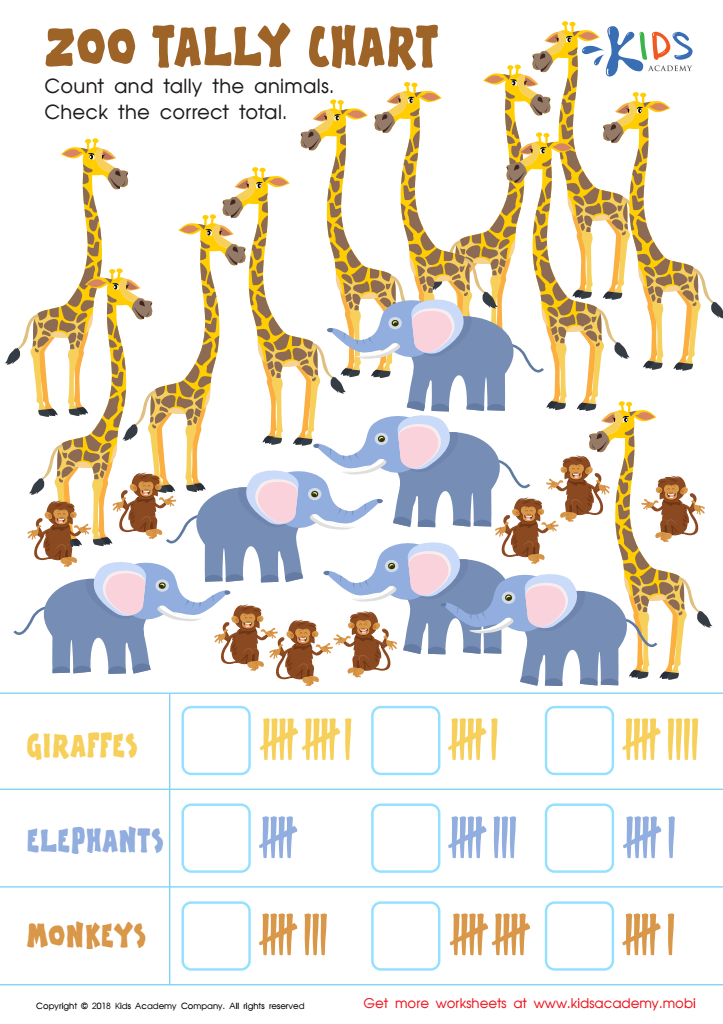
Zoo Tally Chart Worksheet
Your young mathematician will have fun counting and tallying zoo animals on this worksheet! Giraffes, elephants and monkeys - all accurately tallied at the bottom. They will assign values to each animal group to find the answer. It's math but they won't know it - it's a zoo out there!
Zoo Tally Chart Worksheet
Worksheet
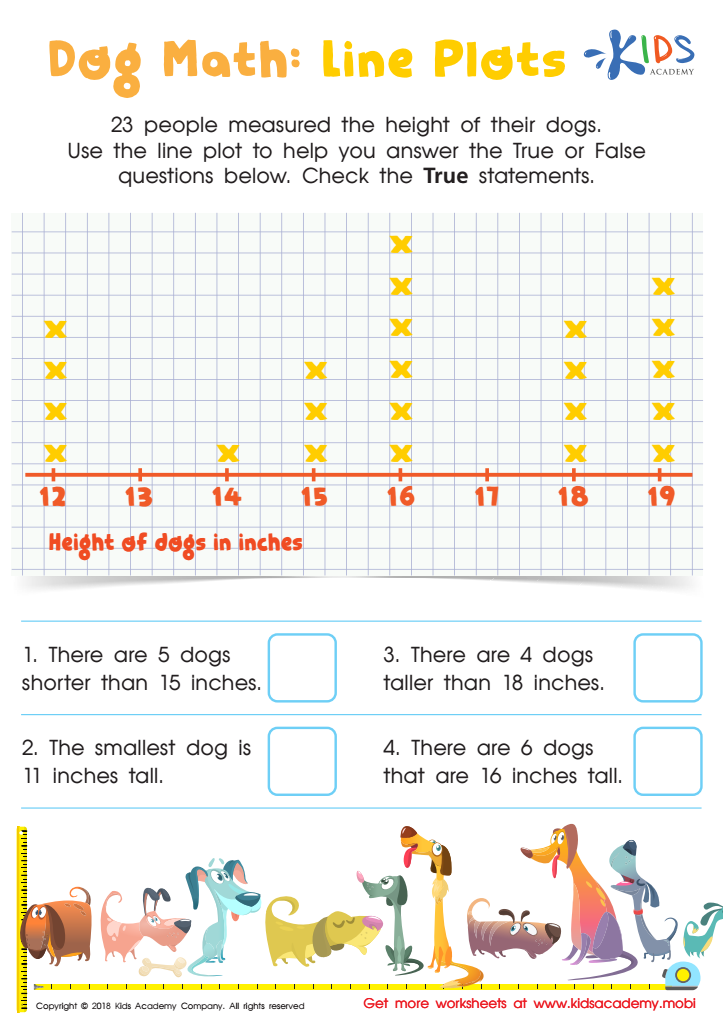
Dog Math: Line Plots Worksheet
Do your kids love dogs? If you have family pets, your kids may be excited to do this worksheet. It involves a line plot and True/False questions about 23 people measuring their dogs' heights. Assist your kids in verifying the statements that are True.
Dog Math: Line Plots Worksheet
Worksheet
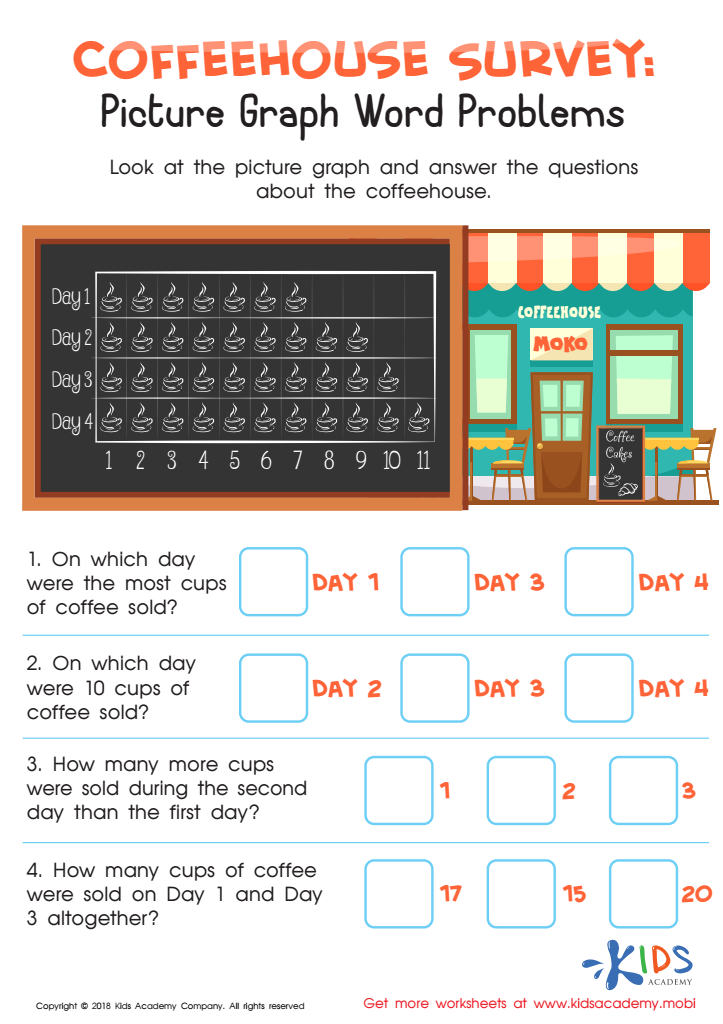
Coffeehouse Survey: Picture Graph Word Problems Worksheet
This coffeehouse survey helps children interpret pictures and answer questions. Your child will look at a picture graph displaying daily coffee cup sales from Day 1 to Day 4. Aid them in answering questions on the number of cups sold and which day had the most sales.
Coffeehouse Survey: Picture Graph Word Problems Worksheet
Worksheet
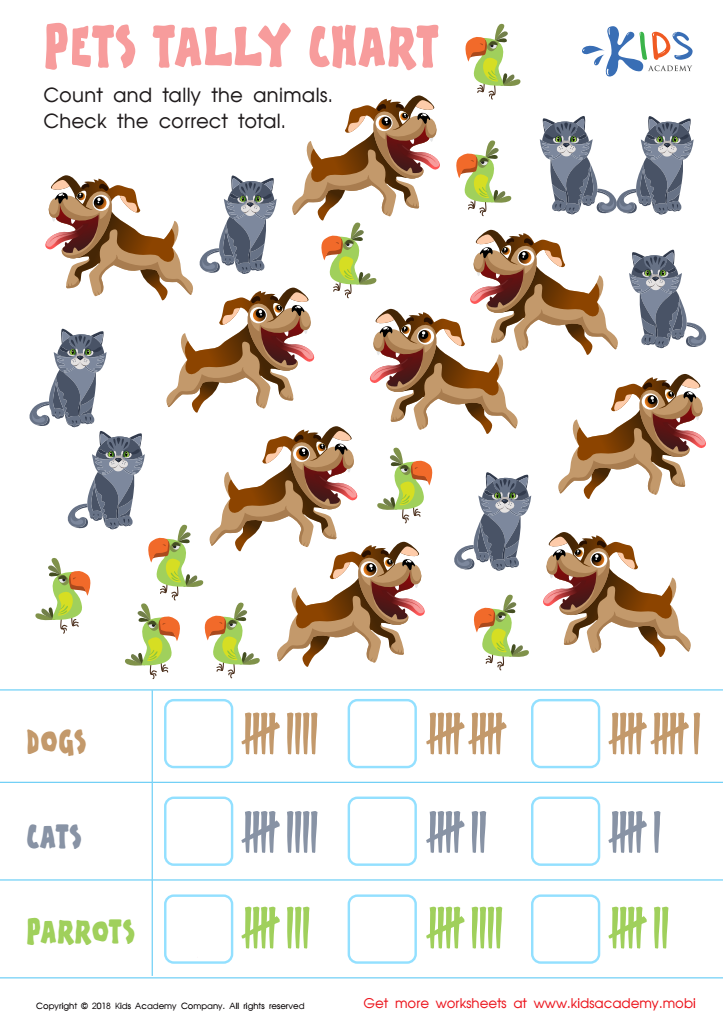
Pets Tally Chart Worksheet
Let your little mathematician count and tally the animals with this fun PDF worksheet. They'll assign value to each pet type and select the correct answer. It's a great way to practice number reasoning and learn how tallying helps keep math organized and efficient when solving equations.
Pets Tally Chart Worksheet
Worksheet

Aircraft Carrier Picture Graphs Worksheet
Kids love learning about jets and boats with this awesome worksheet! It's a great way to engage them as they work on picture graphs. Representing numerical values with pictures, this free PDF requires them to choose which picture graph and representation best match the carrier in the picture. It's also great practice for visual discrimination!
Aircraft Carrier Picture Graphs Worksheet
Worksheet
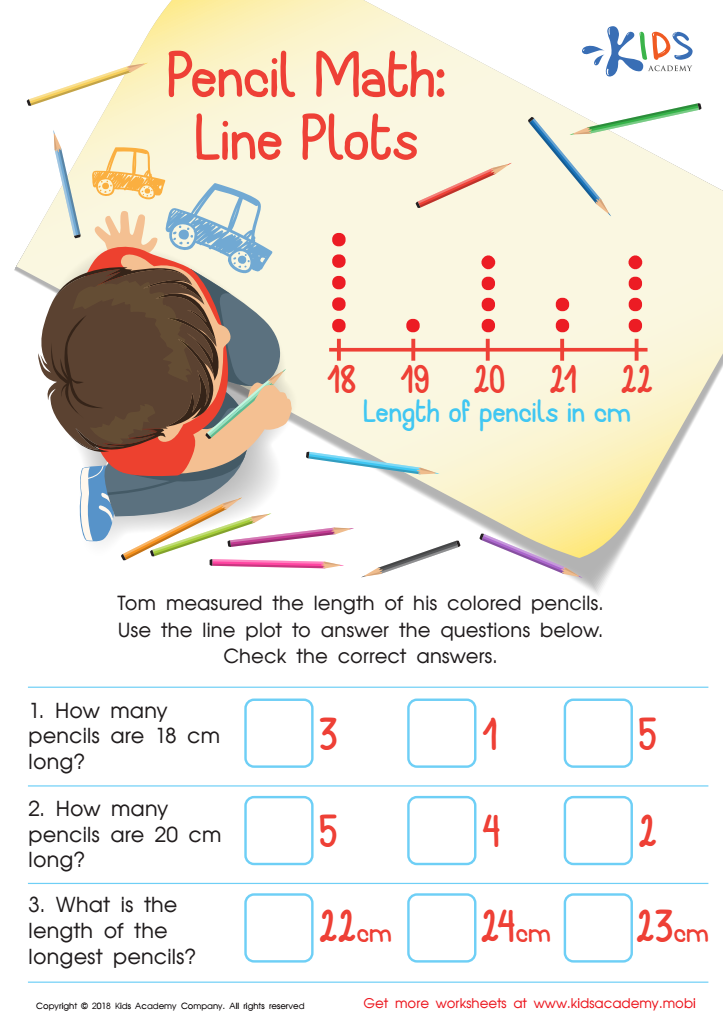
Pencil Math: Line Plots Worksheet
Your child will meet Tom in this worksheet, helping him find the length of his colored pencils. Tom has written the lengths in cm, and the line plot will help your kids answer the questions. Check the correct answers for each, including how many pencils are of a certain length. The line plot makes it easy to find the answers.
Pencil Math: Line Plots Worksheet
Worksheet
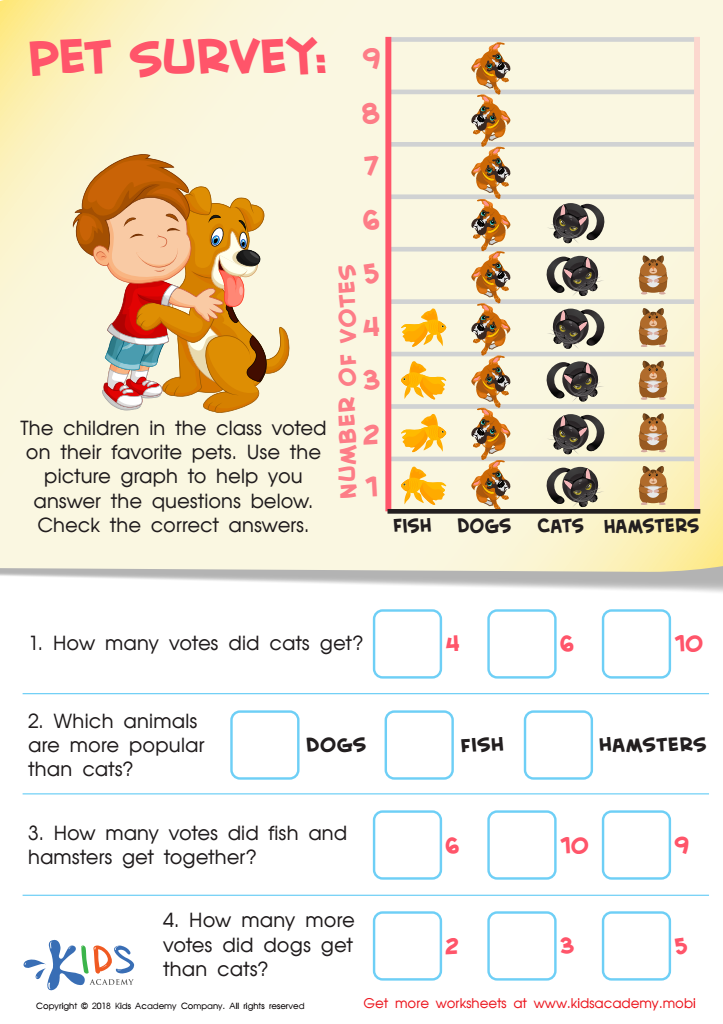
Pet Survey Worksheet
Do you have a furry family member? If the answer is yes and your kids love animals, they'll enjoy this worksheet. The picture graph shows the children's votes for their favorite pet - fish, dog, cat and hamster. Ask your child to use the graph to answer the questions. Guide them to check the right answer.
Pet Survey Worksheet
Worksheet
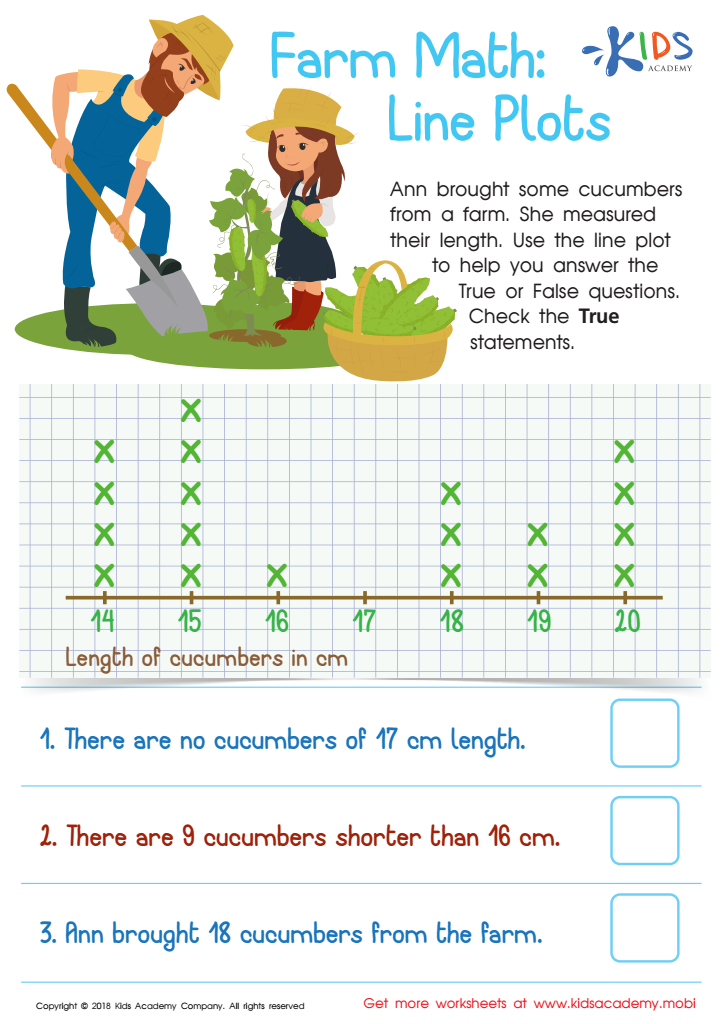
Farm Math: Line Plots Worksheet
Ann brought cucumbers from a farm and measured their length. She drew a line plot for your students to use to answer True/False questions about the number and length of the cucumbers. Ask your students to check only the True statements. (80 words)
Farm Math: Line Plots Worksheet
Worksheet
Join Kids Academy for Free
Who is primarily going to use this learning content?


.jpg)
Data interpretation is a key skill for children ages 7-8, as it lays the foundation for future mathematical learning and critical thinking. For parents and teachers, understanding this skill's importance can significantly enhance a child’s educational experience. At this age, students begin to engage with basic statistics, which involves organizing, interpreting, and making sense of data through charts, graphs, and simple mathematical concepts.
Learning to interpret data helps children develop logical reasoning and problem-solving skills, crucial not only in mathematics but also in everyday situations. It fosters a sense of curiosity, encouraging them to ask questions and search for answers based on evidence. Moreover, exposing children to data interpretation at an early age prepares them for more complex mathematical concepts in the future, such as probability, averages, and relationships between variables.
Parents and teachers can facilitate learning by integrating data interpretation into daily activities. Simple tasks like tracking weather patterns, sports statistics, or even class test scores can turn learning into a fun and engaging experience. Ultimately, investing time in data interpretation promotes a child's confidence in mathematics, nurturing a generation that can think critically and draw conclusions from the world around them.