Graph interpretation Worksheets for Kids
5 filtered results
-
From - To

Taxi Math Worksheet
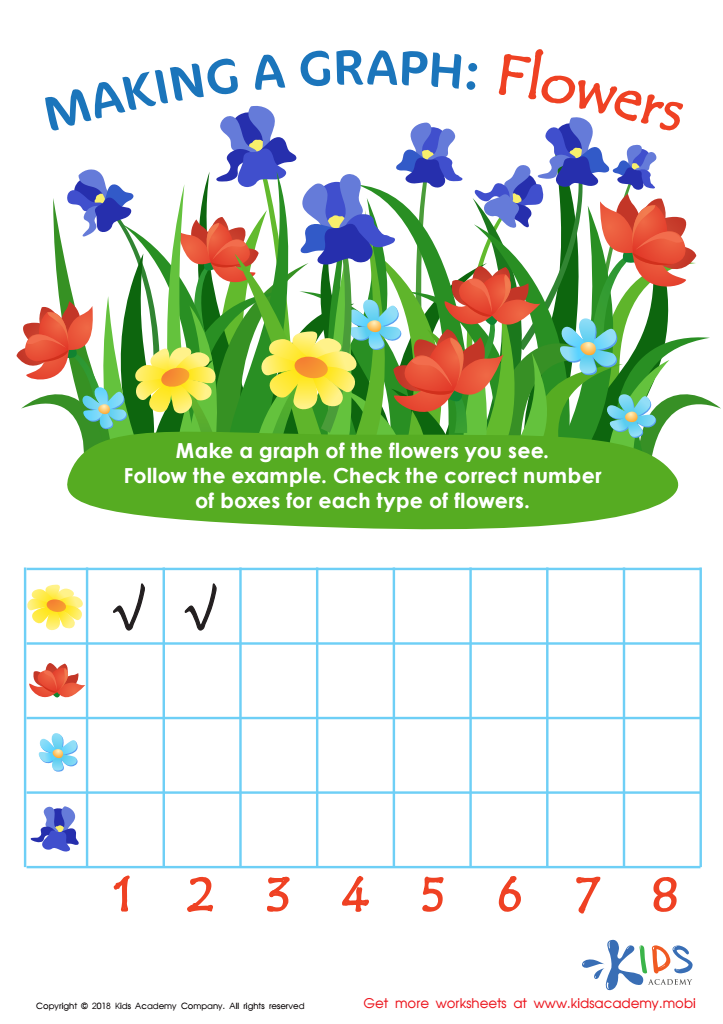
Making a Graph: Flowers Worksheet

Graph: Baby Animals Worksheet
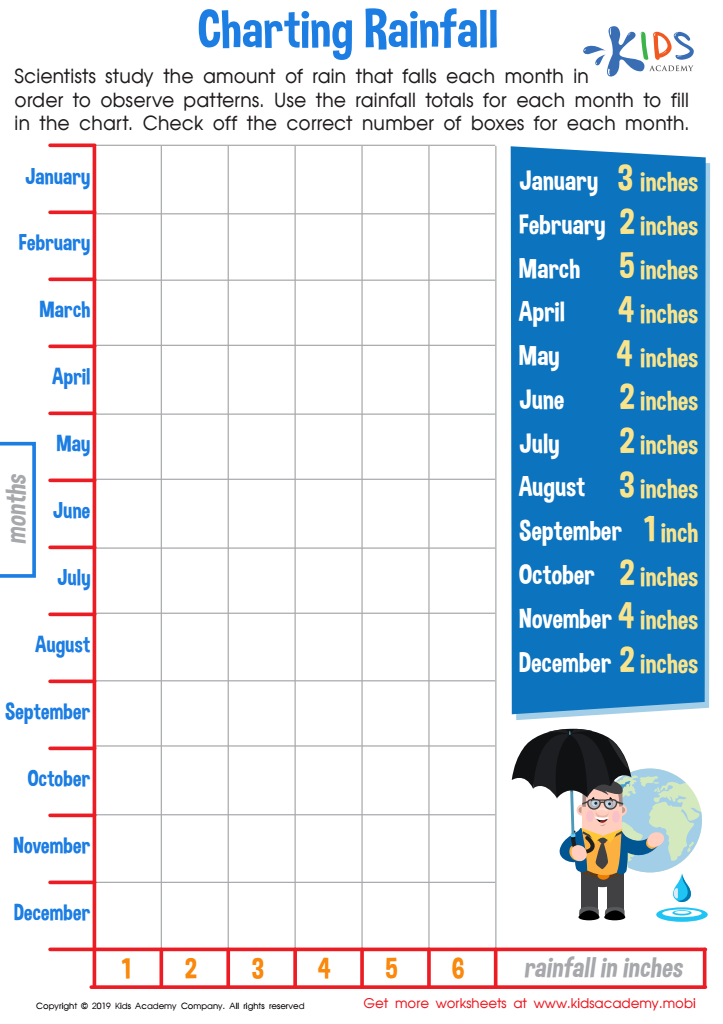
Charting Rainfall Worksheet
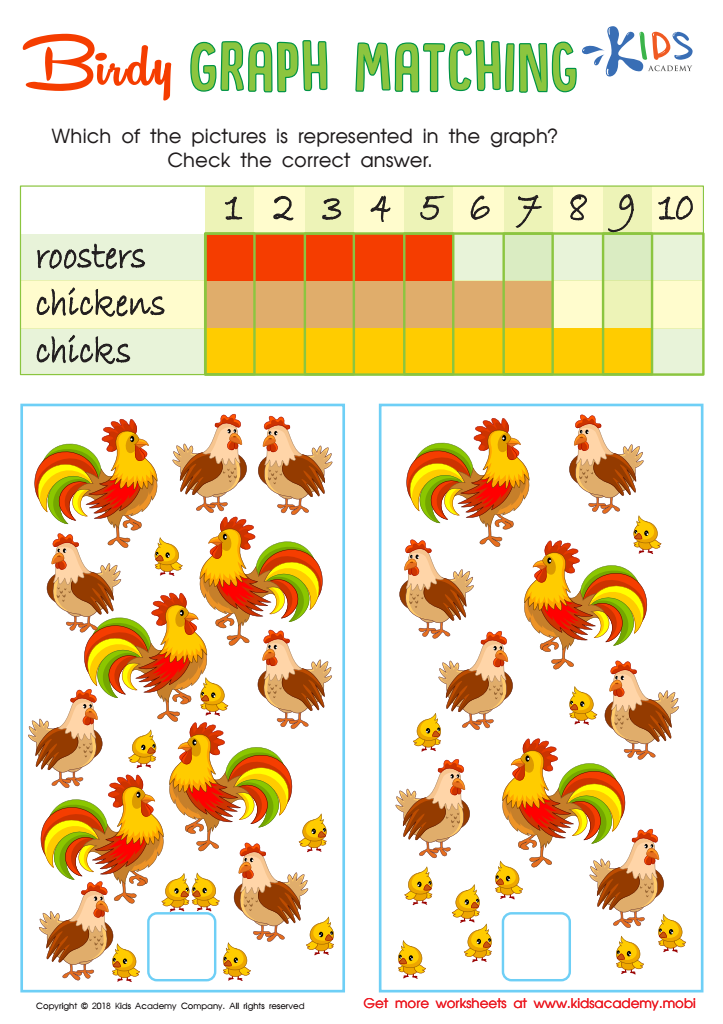
Birdy Graph Matching Worksheet
Question/Answer
What are some effective activities to train students’ Graph interpretation skill when teaching them about Numbers?
Effective activities for training students in graph interpretation include creating and interpreting their own graphs from collected data, engaging in graph matching exercises where they match descriptions to the correct graph, using real-life data to draw graphs and extract information, and playing interactive graph interpretation games that challenge them to answer questions based on different types of graphs (bar, line, pie charts).#$%
How to test a Grade 1 student’s Graph interpretation skills?
To test a Grade 1 student's graph interpretation skills, you can provide a simple pictograph or bar chart with basic, familiar items (e. g. , fruits, pets).
What does the Graph interpretation skill mean when it comes to Grade 1 Numbers learning?
Graph interpretation skill in Grade 1 Numbers learning involves understanding basic graphical representations like pictographs or simple bar graphs. At this level, students learn to recognize and interpret simple visual data, such as identifying the quantity represented by symbols or comparing quantities shown on a graph, helping them develop foundational skills in data analysis and mathematical reasoning.