Interpreting visual data Worksheets for Kids
2 filtered results
-
From - To
Question/Answer
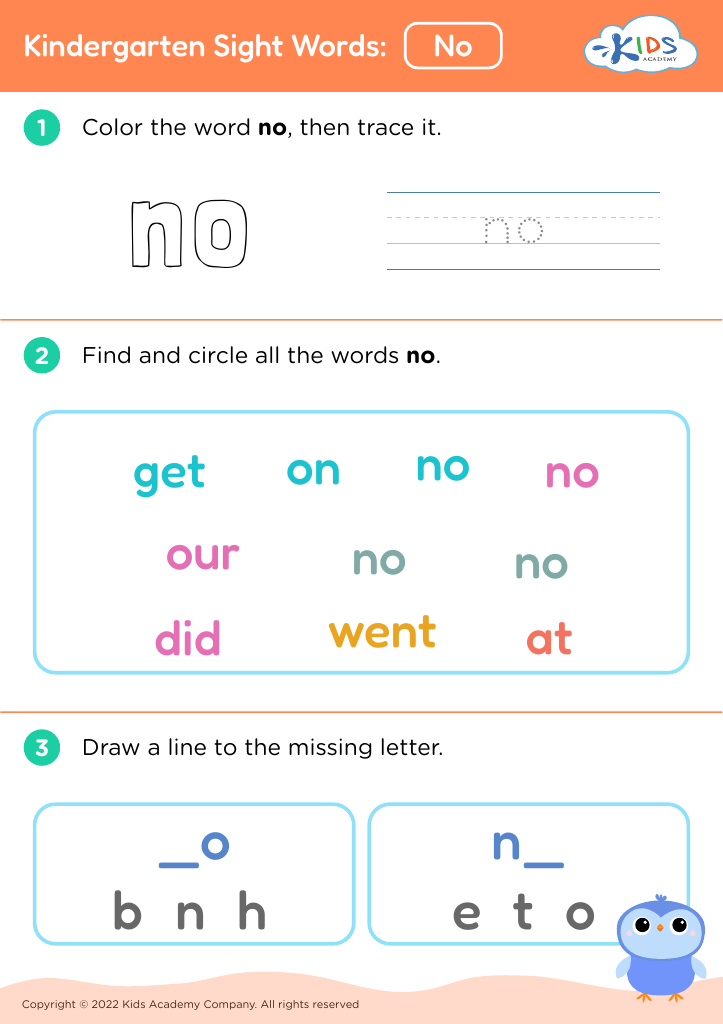
What are some effective activities to train students’ Interpreting visual data skill when teaching them about Sight Words?
Effective activities for training students in interpreting visual data while teaching Sight Words include: creating word-picture matching games, using flashcards with images and words, organizing sight word scavenger hunts with visual clues, implementing interactive digital apps that combine visual cues with text, and engaging students in sorting activities using images associated with specific sight words.
Why is the Interpreting visual data skill important for Kindergarten students?
Interpreting visual data is important for Kindergarten students because it cultivates critical thinking, enhances observational skills, and supports the development of numeracy and literacy. By learning to analyze and understand visual information, children are better equipped to make connections, solve problems, and communicate ideas effectively, laying a strong foundation for academic success and everyday life navigation.
How to test a Kindergarten student’s Interpreting visual data skills?
To test a Kindergarten student's interpreting visual data skills, provide simple charts or pictures with basic information, such as a pictograph with familiar objects. Ask the child to explain what they see and to answer simple questions about the data presented, such as counting items, identifying patterns, or recognizing differences and similarities.