Understanding line plots Worksheets for Kids
10 filtered results
-
From - To
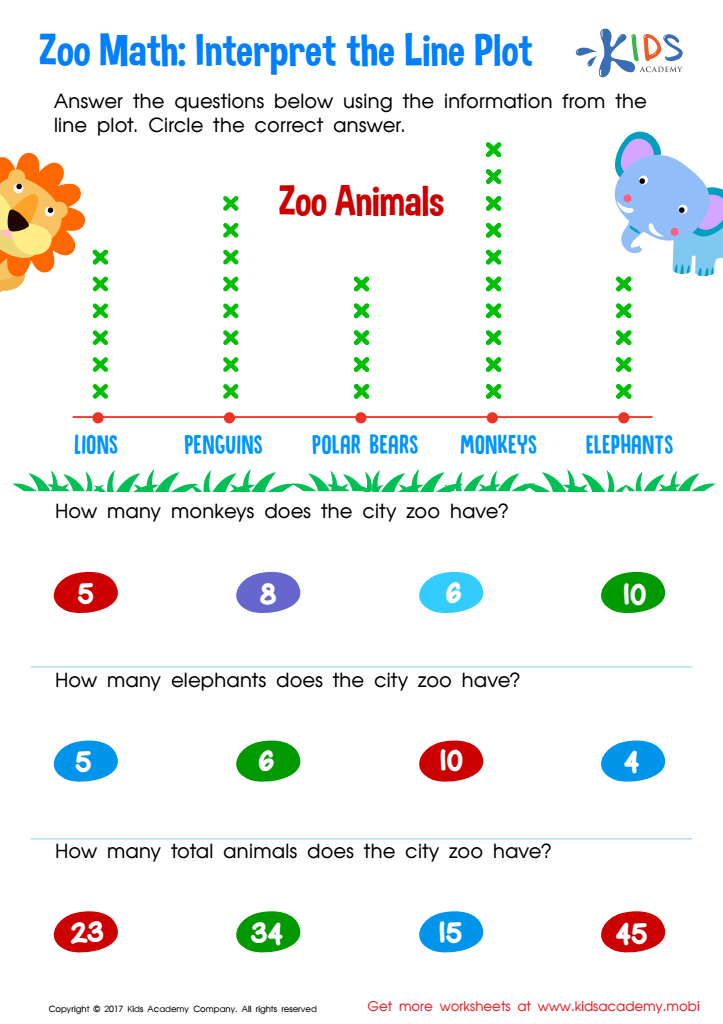

Interpret Line Plot Worksheet


What Is a Line Plot? Worksheet
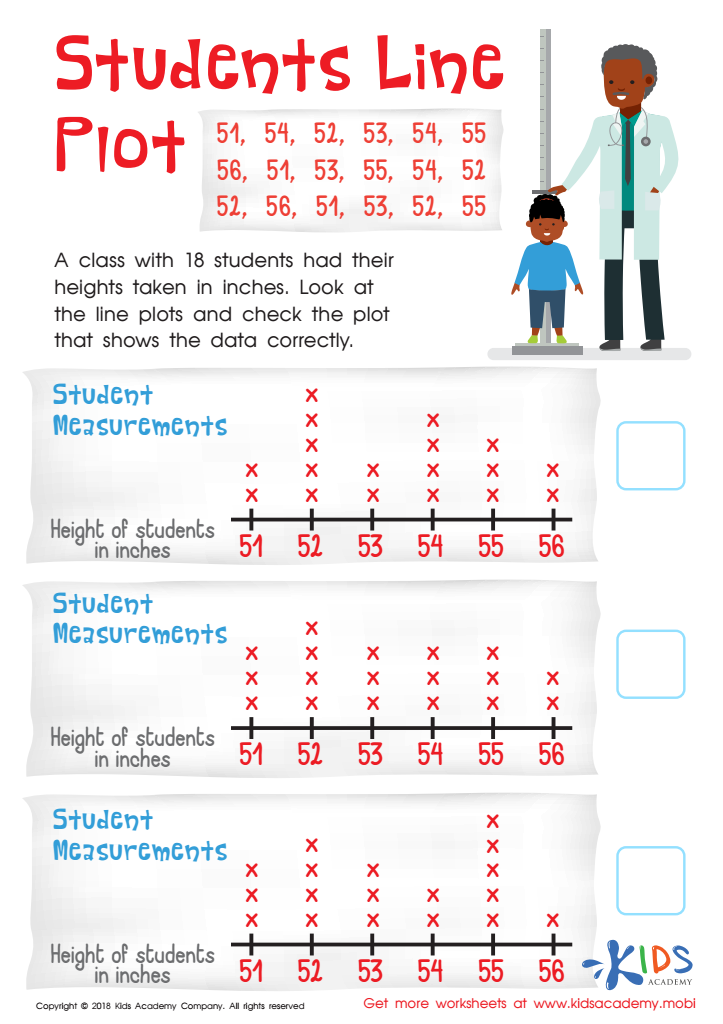

Students Line Plot Worksheet
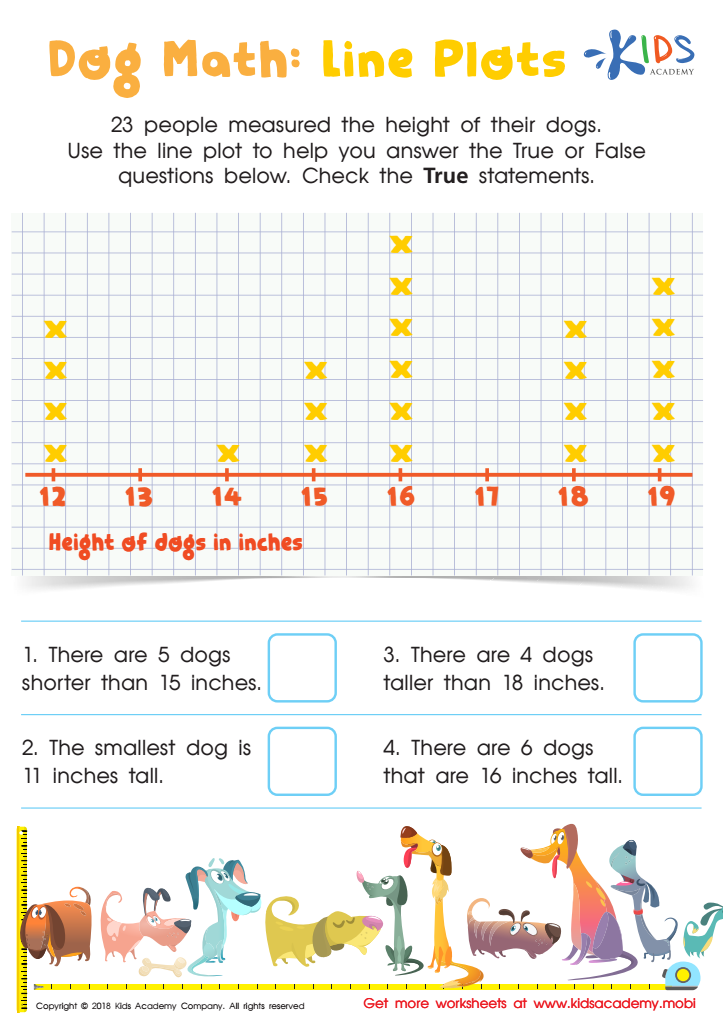

Dog Math: Line Plots Worksheet
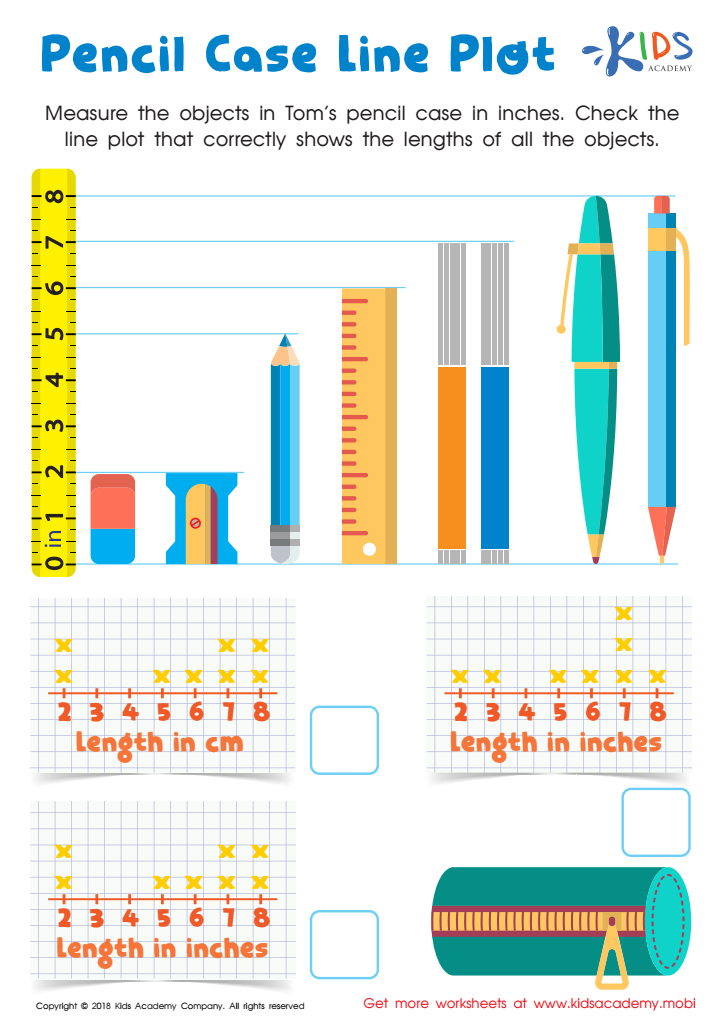

Pencil Case Line Plot Worksheet
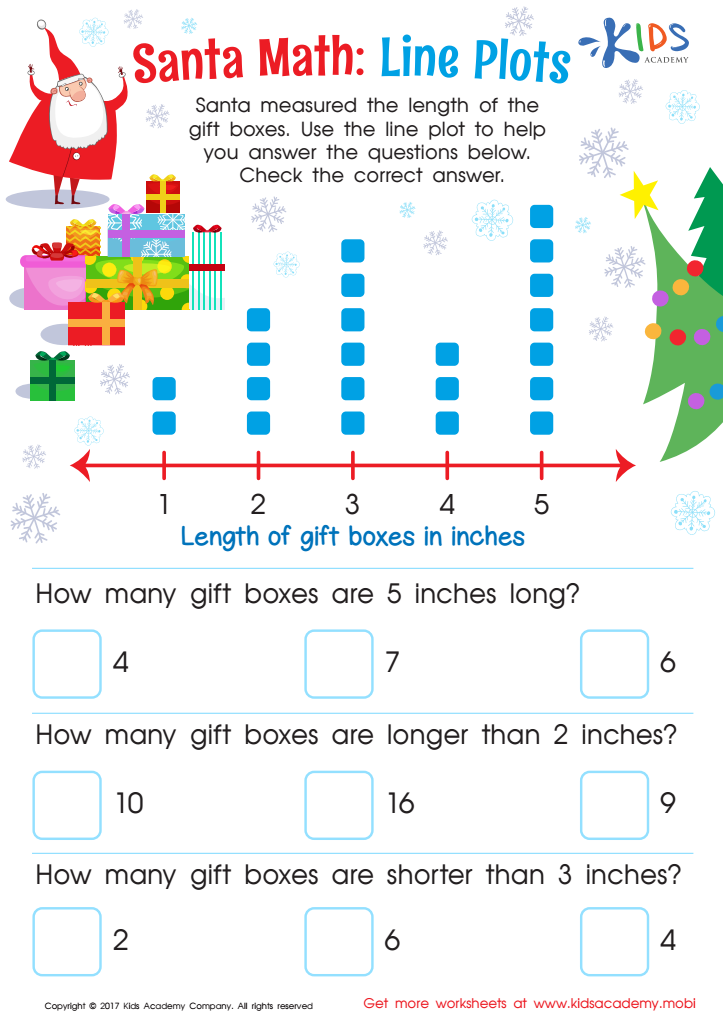

Line Plot Worksheet
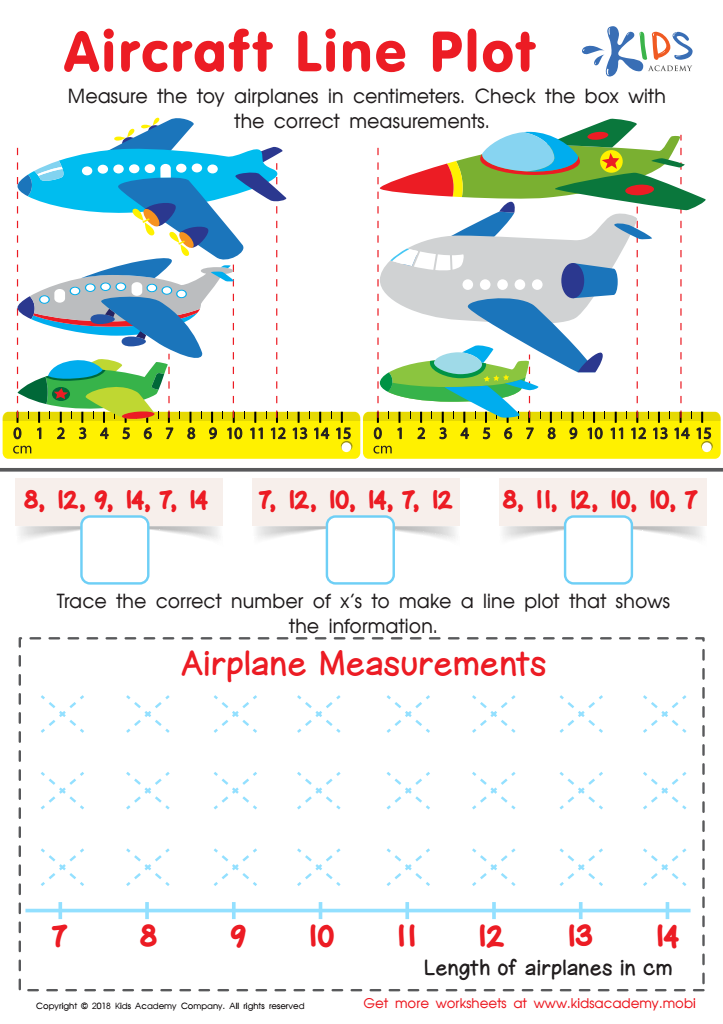

Aircraft Line Plot Worksheet
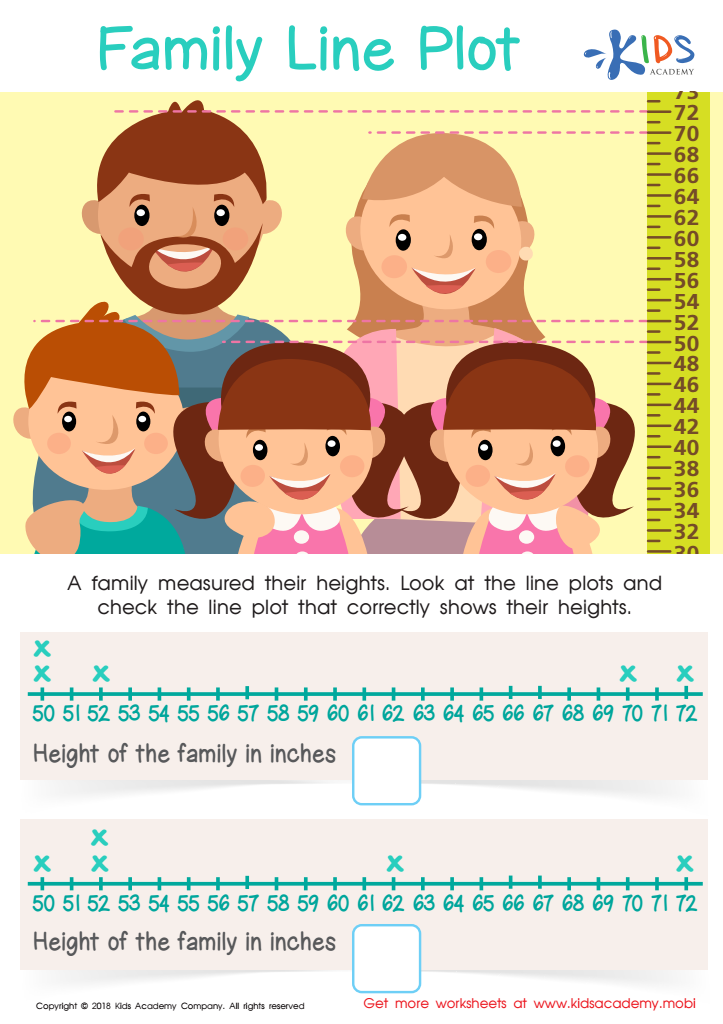

Family Line Plot Worksheet
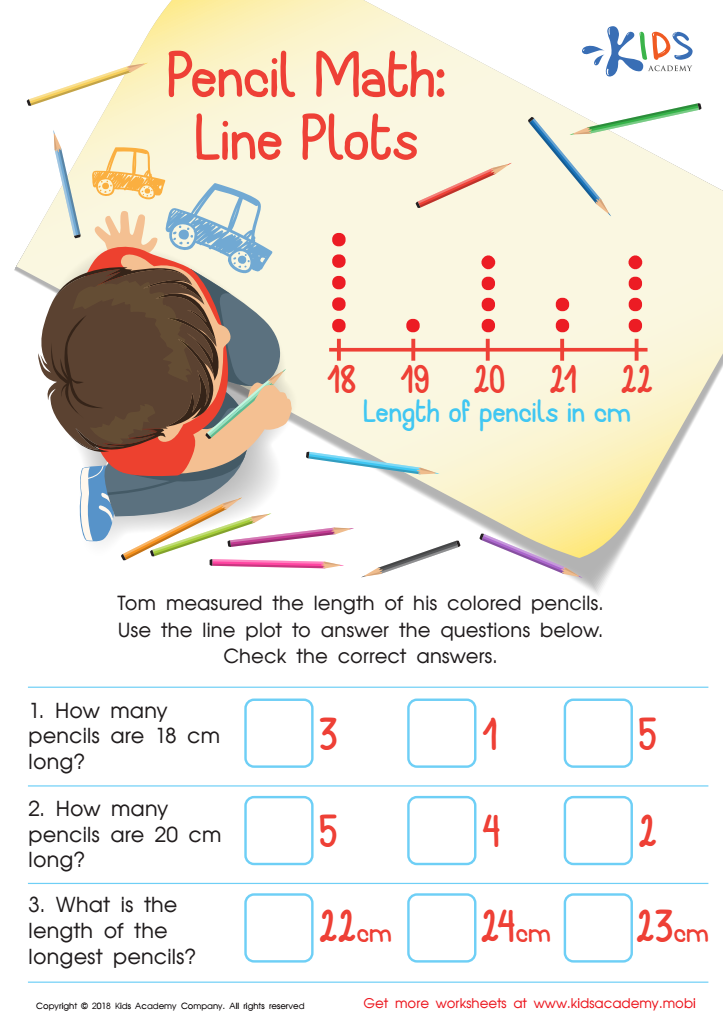

Pencil Math: Line Plots Worksheet
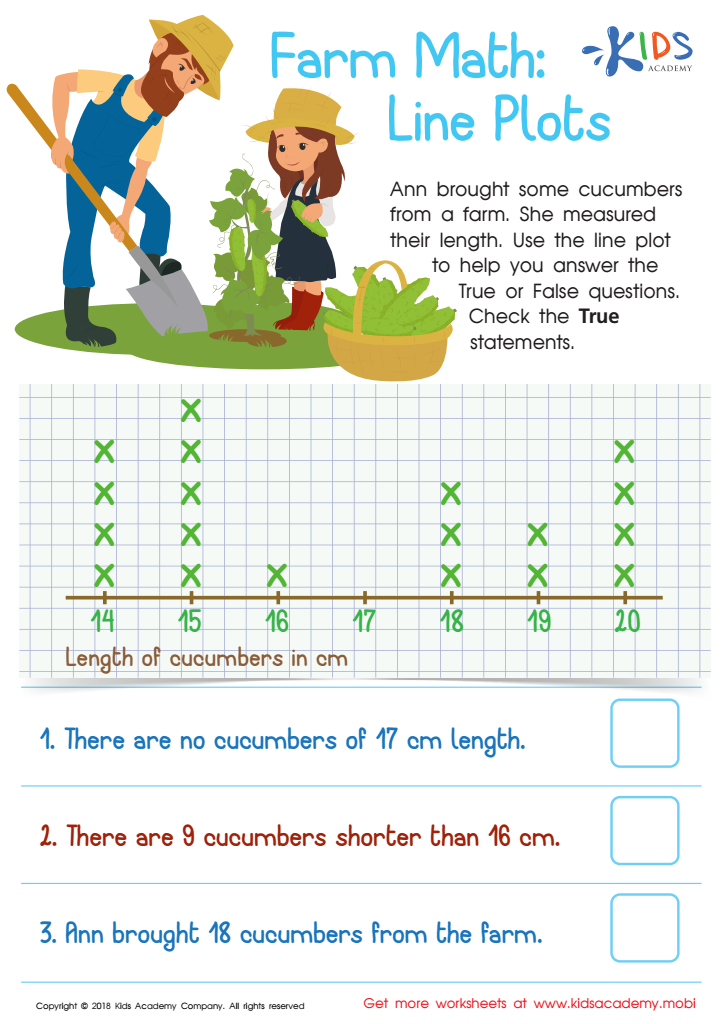

Farm Math: Line Plots Worksheet
Question/Answer
What are some effective activities to train students’ Understanding line plots skill when teaching them about Measurement?
To train students in understanding line plots, engage them in activities like creating line plots from collected data (e. g. , measuring classmates' heights, lengths of objects), interpreting given line plots to answer questions, comparing two line plots to discuss differences, and using interactive online quizzes or games that require students to manipulate and analyze line plots.
What does the Understanding line plots skill mean when it comes to Grade 2 Measurement learning?
The Understanding line plots skill in Grade 2 Measurement involves teaching students how to create, read, and interpret simple line plots. This includes showing them how to organize and represent data using a number line where each mark or dot represents a data point. It's a foundational step in teaching young learners how to visualize and analyze data.
Why is the Understanding line plots skill important for Grade 2 students?
The Understanding line plots skill is important for Grade 2 students as it lays the foundation for data interpretation and mathematical reasoning. It helps them learn how to visually represent data, identify patterns, and understand measurements. Mastering this skill early enhances their ability to analyze information, which is crucial for their success in higher-level math and science subjects.

 Assign to the classroom


