Interpreting data Normal Worksheets for Ages 8-9
3 filtered results
-
From - To
Unlock the power of data literacy with our "Interpreting Data Normal Worksheets" for ages 8-9. Specifically designed for 3rd and 4th graders, these engaging worksheets enhance critical thinking and analytical skills. Kids will learn to read, analyze, and interpret various data sets including charts, graphs, and tables. Boost their math confidence as they delve into meaningful exercises that transform abstract numbers into actionable insights. Perfect for classroom activities or homework, these worksheets align with Common Core standards and ensure a fun, educational experience. Equip young learners with the essential tools to excel in interpreting data, setting them up for academic success.
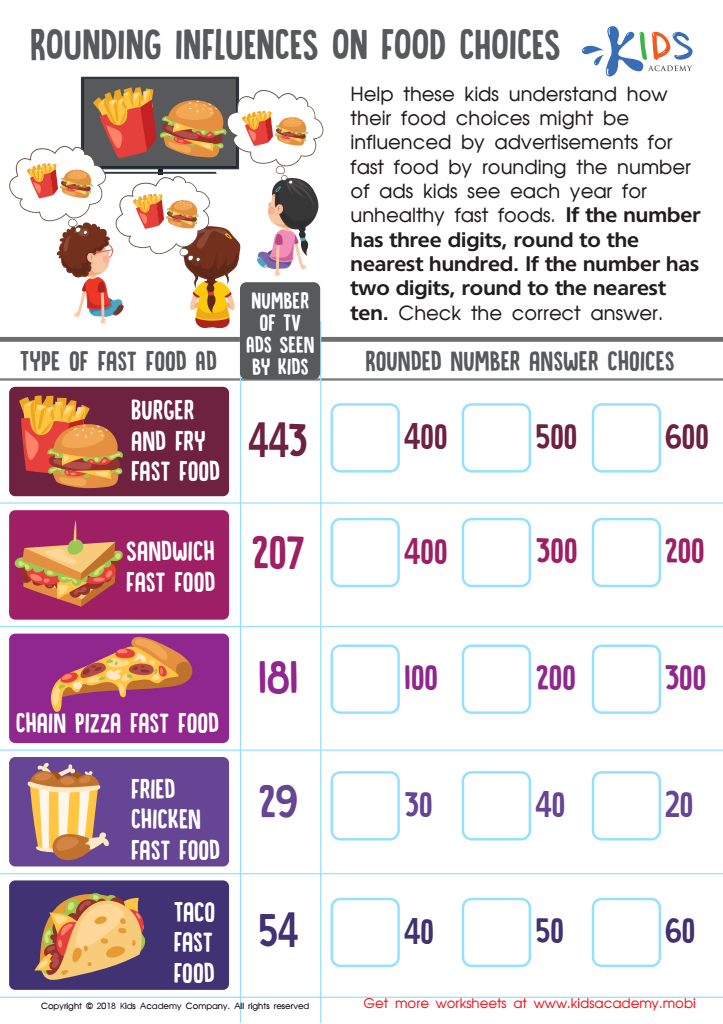
Rounding Influences Food Choices Worksheet
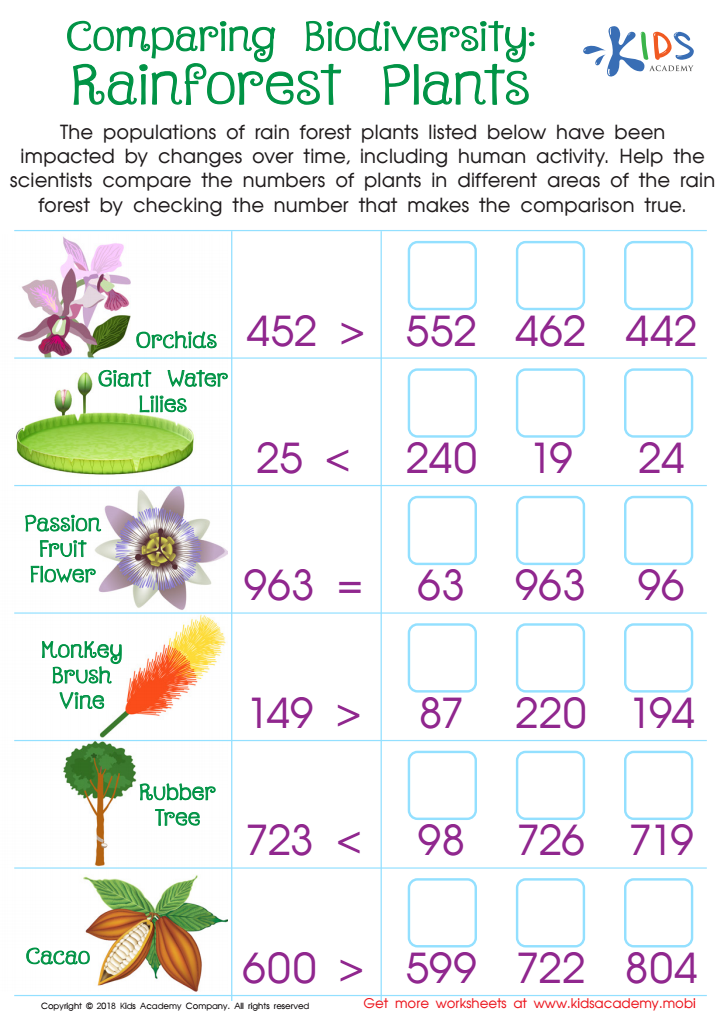
Comparing Biodiversity: Rainforest Plants Worksheet
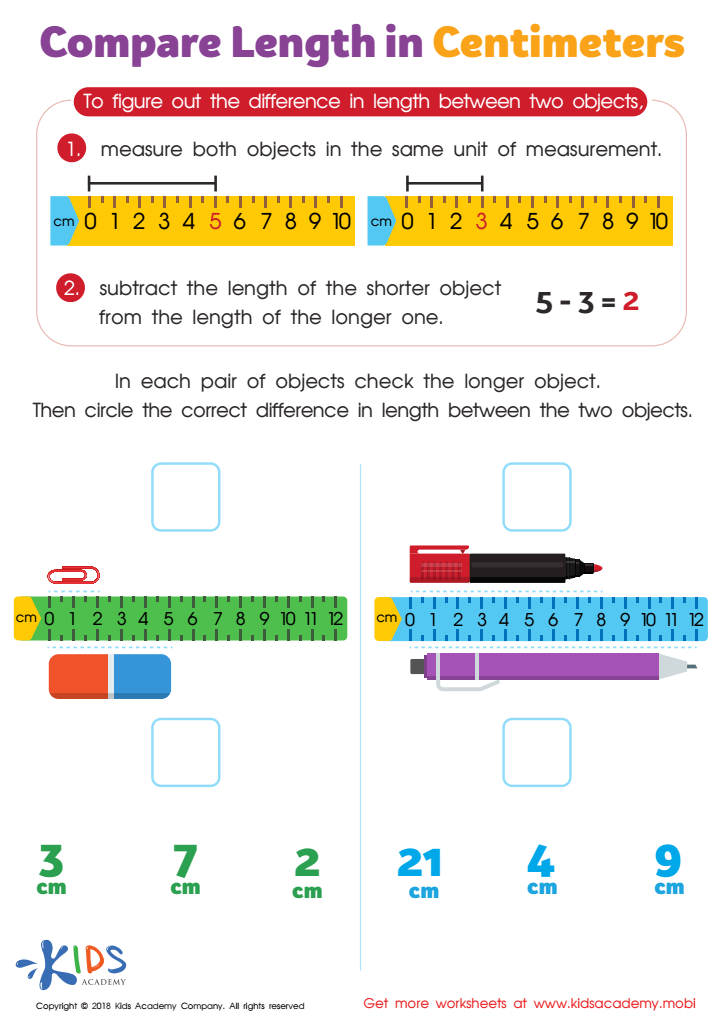
Compare Length in Centimeters Worksheet


Interpretation of data is an essential skill that helps children make sense of the world around them, and it's never too early to start. For ages 8-9, understanding data in its most basic form—like bar graphs, line plots, and simple statistics—can significantly enhance their critical thinking and problem-solving abilities. Here’s why parents and teachers should care:
First, data interpretation aligns with curriculum goals, promoting foundational math and science proficiencies. It nurtures logical thinking, enabling children to analyze evidence and draw conclusions. In today’s data-driven society, these skills are invaluable for future academic and professional success.
Second, dealing with data encourages curiosity and inquiry. By interpreting numbers and patterns, children learn to ask insightful questions and find data-backed answers. This grows their confidence in applying knowledge practically, fostering a deeper understanding of various subjects.
Moreover, data interpretation helps children grasp real-world concepts, such as tracking their own growth (height, reading progress), understanding weather charts, or comparing sports statistics. This relevance makes learning engaging and meaningful.
Finally, mastering data interpretation at an early age lays a groundwork for advanced mathematical concepts that they will encounter later. It builds a strong foundation for higher education, where data literacy is increasingly central.
In essence, introducing data interpretation to young learners equips them with critical skills, making them more adept, inquisitive, and ready for future challenges.