Easy Graphs Worksheets for Ages 4-8
6 filtered results
-
From - To
Introduce your young learners, ages 4-8, to the world of data with our Easy Graphs Worksheets. These vibrant, engaging activity sheets provide an enjoyable way for kids to learn about charts, graphs, and data interpretation. Perfect for early graders, each worksheet is thoughtfully designed to enhance counting, sorting, and analyzing skills while sparking curiosity. With colorful graphics and age-appropriate exercises, children can easily grasp fundamental concepts, laying a solid mathematical foundation. Ideal for classroom or at-home practice, our worksheets make learning about graphs fun and easy. Start exploring today to help your child become a confident, young data expert!

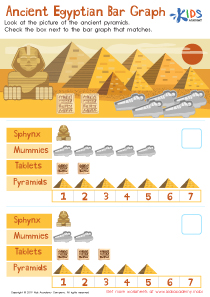
Egyptian Bar Graph Worksheet

Aircraft Carrier Picture Graphs Worksheet
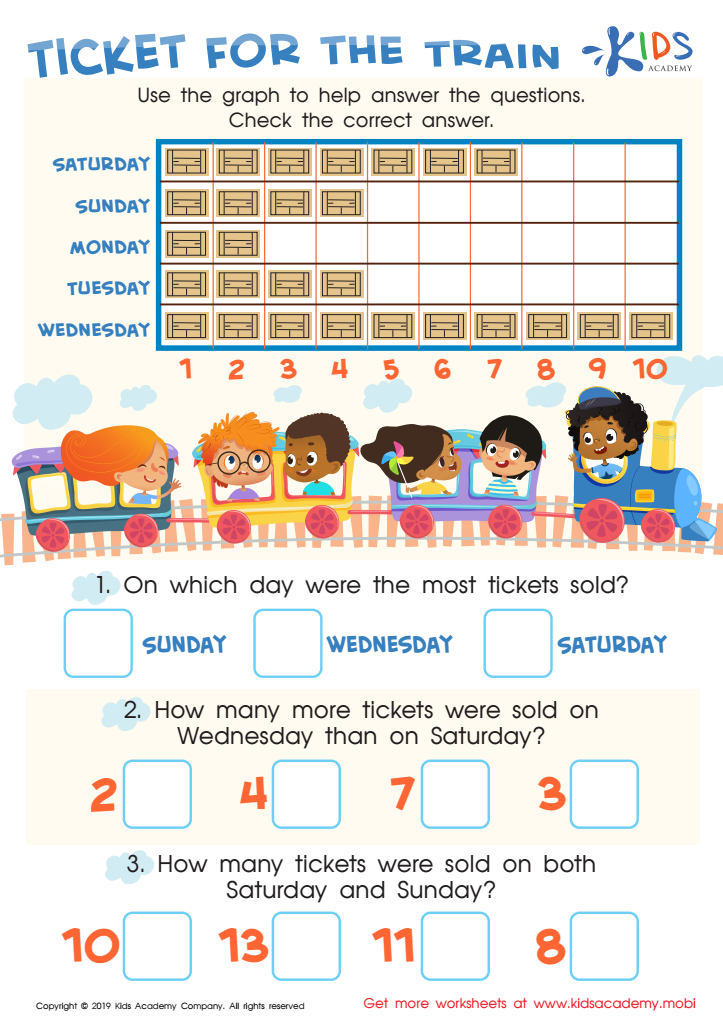
Ticket for the Train Worksheet

Fruit Math: Picture Graphs Worksheet
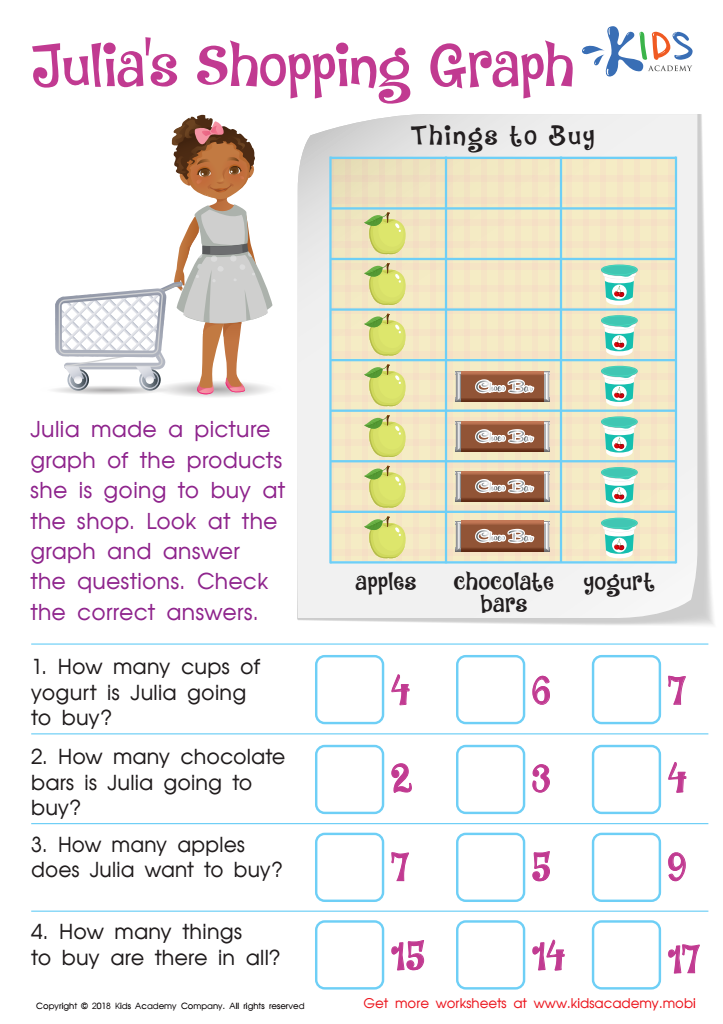
Julia's Shopping Graph Worksheet
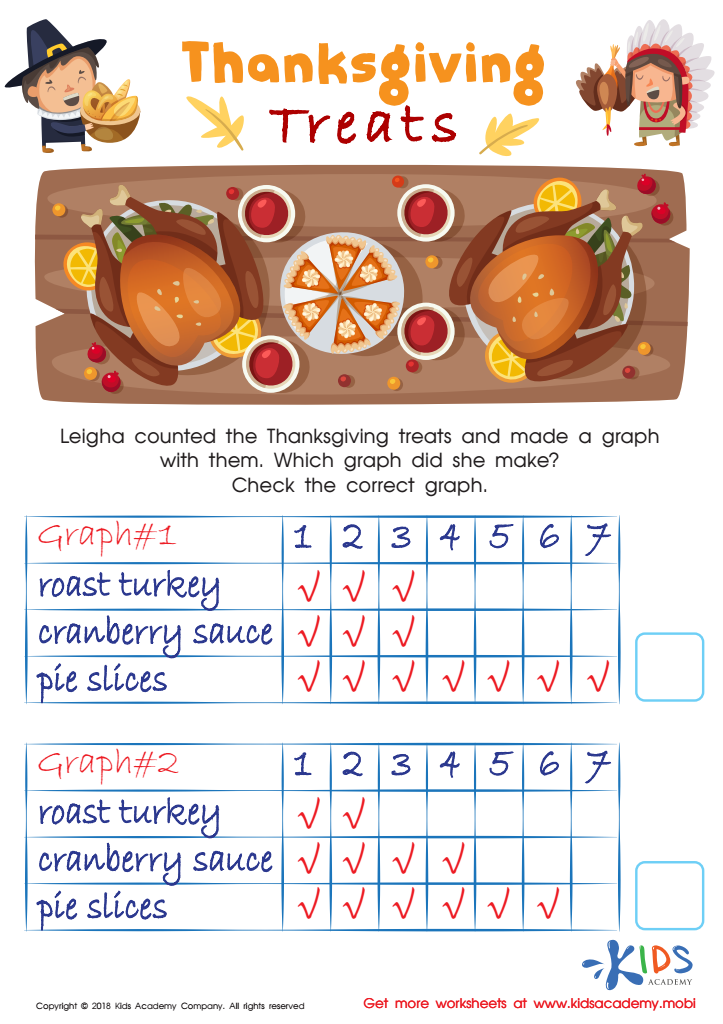
Graphs: Thanksgiving Treats Worksheet


Parents and teachers should seriously consider the importance of Easy Graphs for children aged 4-8 because it introduces foundational elements of data literacy and critical thinking early. At this formative stage, children's cognitive and analytical skills are rapidly developing. Introducing simple graph activities can foster numerical literacy and statistical understanding in a fun, approachable manner.
Graphs enhance visual learning and make abstract mathematical concepts more tangible. For example, bar graphs can teach children to compare quantities effectively, while pictographs use engaging images to represent data that children can easily relate to. These activities are not only educational but also enjoyable, maintaining their interest and engagement.
Moreover, learning to interpret and create graphs helps children learn how to organize information systematically. Such skills are beneficial across all subjects and everyday life. Understanding how to collect, analyze, and present data can build a child's confidence in handling complex information as they grow older.
In a world increasingly driven by data, nurturing these skills from a young age gives children a competitive advantage. Easy Graphs provide a critical stepping stone towards more advanced STEM subjects and encourage a mindset geared towards inquiry and evidence-based reasoning. Ultimately, including these activities ensures that children are not merely consumers of data, but informed and discerning individuals.