Interpreting data Grade 2 Worksheets
4 filtered results
-
From - To
Discover engaging and interactive Grade 2 worksheets designed to help young learners master the skill of interpreting data. Our carefully crafted resources introduce concepts such as reading charts, understanding bar graphs, and analyzing pictograms, all suitable for second-grade students. These worksheets enhance critical thinking and foster analytical skills in a fun and age-appropriate way. With various engaging activities, children will learn to gather, interpret, and present data confidently. Perfect for classroom use or home practice, our Interpreting Data worksheets align with educational standards, ensuring a comprehensive learning experience. Explore, practice, and watch your child excel in data interpretation today!
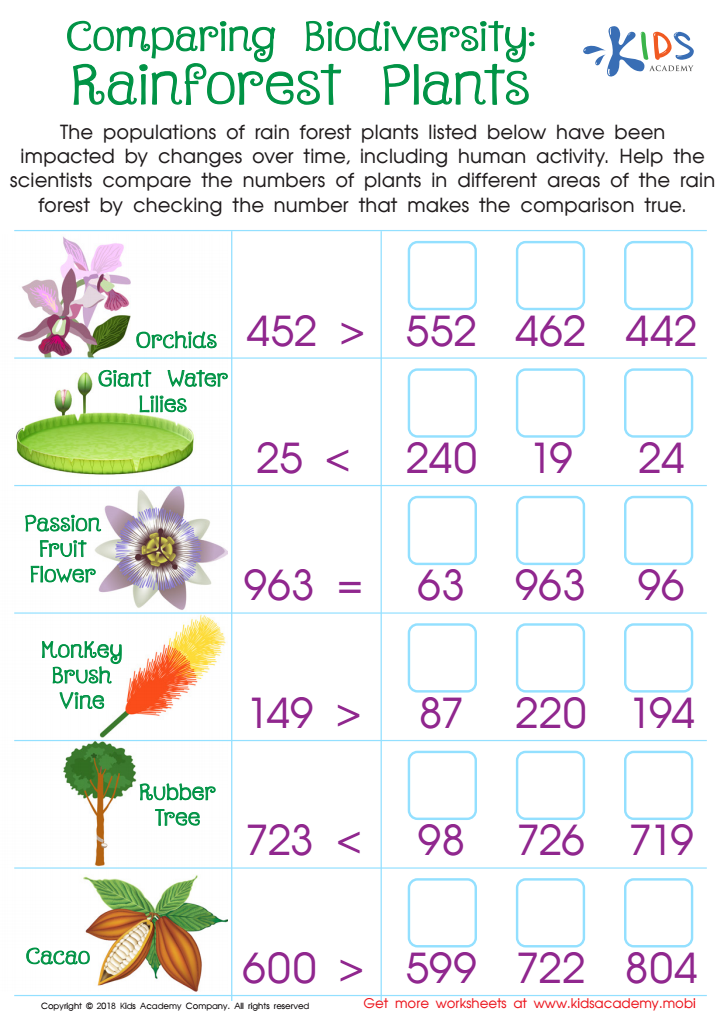
Comparing Biodiversity: Rainforest Plants Worksheet
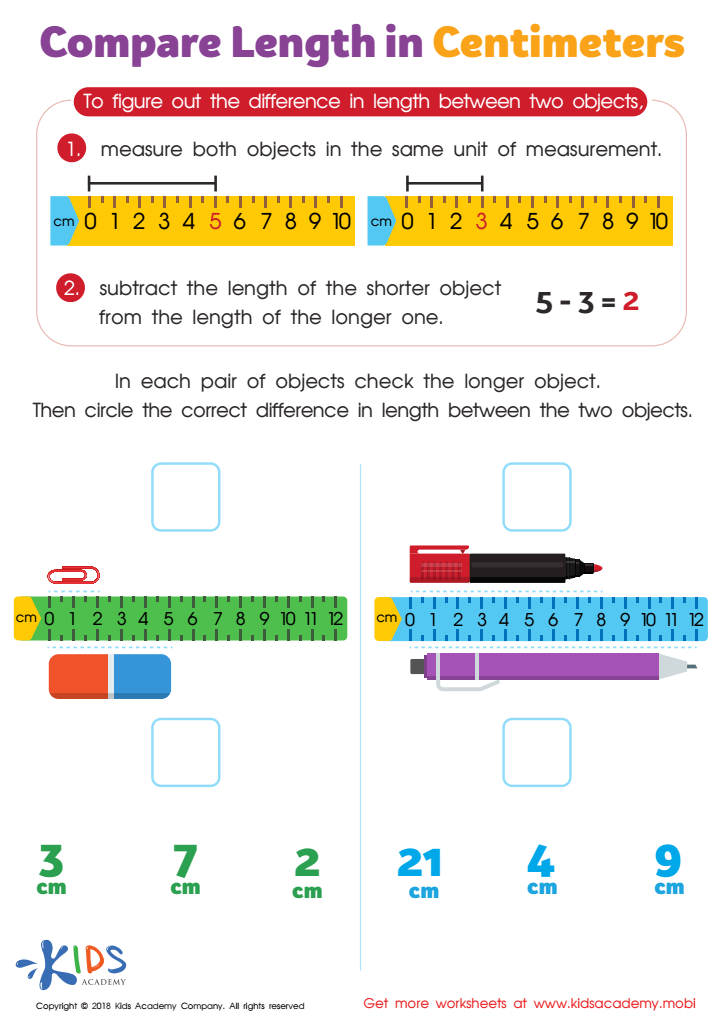
Compare Length in Centimeters Worksheet

Pencil Case Line Plot Worksheet

Family Line Plot Worksheet


Interpreting data in Grade 2 is an essential skill that both parents and teachers should prioritize for several reasons. Firstly, children at this stage are developing their analytical thinking. Learning to interpret data helps them make sense of information they encounter in everyday life, whether it's understanding weather patterns, survey results from friends, or basic statistical concepts.
Moreover, data interpretation lays the foundation for future academic success in subjects like math and science, where data analysis plays a critical role. Parents and teachers can encourage this skill by integrating data interpretation into fun, interactive activities, such as collecting data on favorite snacks, sports, or books, and representing that information through charts and graphs.
Furthermore, nurturing data interpretation skills fosters critical thinking and decision-making abilities. It encourages children to ask questions, analyze outcomes, and draw conclusions, which are valuable skills that extend beyond the classroom.
Lastly, parents and teachers play a pivotal role in helping children understand that data is not just numbers—it's a representation of real-world phenomena. Engaging with data positively influences children's mindset, preparing them for an increasingly data-driven world. By focusing on these skills now, we set them up for lifelong learning and informed citizenship.