Graphs Worksheets for Ages 4-8 - Page 2
27 filtered results
-
From - To
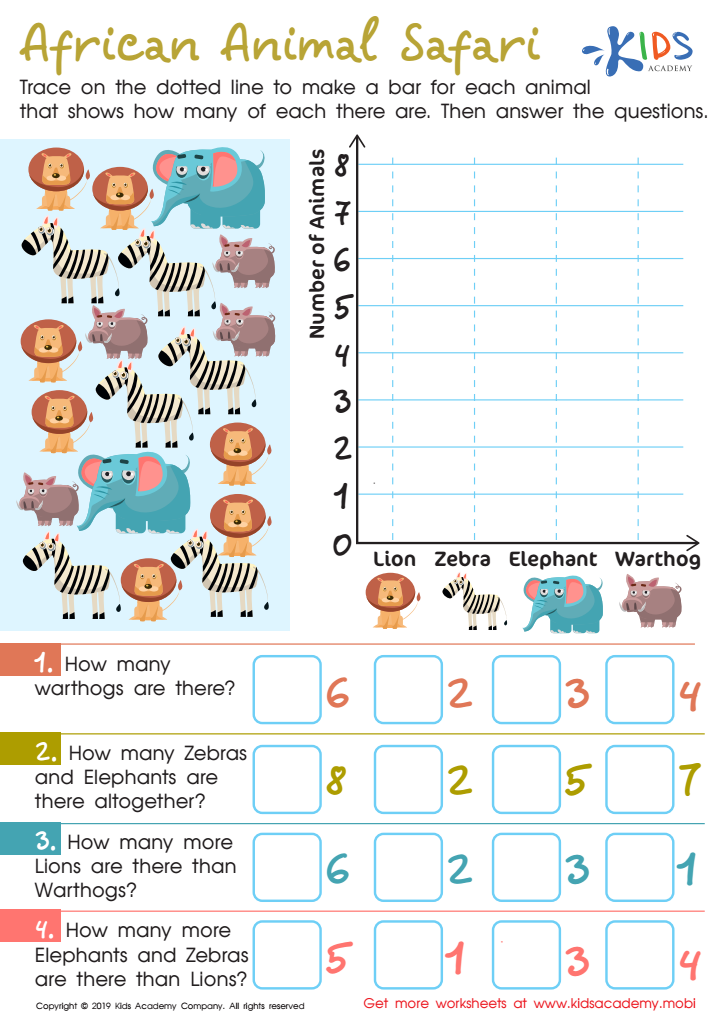
African Animal Safari Worksheet

Leaf Measure Line Plot Worksheet

Football Math Worksheet


Introducing children aged 4-8 to graphs is enormously beneficial for their cognitive and mathematical development. At this early stage, children are like sponges, absorbing information and learning new concepts rapidly. Graphs encourage critical thinking and problem-solving skills by visually representing data that can be tangible and relatable to them, such as counting objects, tracking weather changes, or favorite fruits among classmates.
When parents and teachers use graphs, they help children cultivate the ability to organize and interpret information systematically. For instance, a simple bar graph comparing the number of apples versus oranges in a fruit bowl allows kids to visually see quantities, bolstering their counting skills and introducing them to early mathematical concepts like comparison and addition.
Moreover, engaging with graphs nurtures essential visual literacy. In an increasingly data-driven world, understanding graphs helps children later on in school and daily life by preparing them to interpret charts, infographics, and other visual data presentations effectively.
Parents can also use this tool to make learning more engaging at home, connecting what children learn in school with everyday activities, thereby reinforcing and expanding their knowledge base. Overall, introducing graphs at an early age lays a strong foundation for logical reasoning, numeracy, and data literacy, which are critical skills in our world today.


