
Understanding line plots Worksheets for Ages 5-7
9 filtered results
Difficulty Level
Grade
Age
-
From - To
Subject
Activity
Standards
Unlock the world of data for young learners with our "Understanding Line Plots Worksheets for Ages 5-7." Tailored specifically for kindergarten to 1st-grade students, these engaging and interactive worksheets introduce the basics of line plots in a fun and accessible way. Children will learn to create, read, and interpret simple line plots, enhancing their early math and analytical skills. Each worksheet is designed to capture the curiosity of young minds, promoting hands-on practice and building a strong foundation for future data analysis. Help your child explore the exciting realm of line plots today!
Favorites
With answer key
Interactive

What Is a Line Plot? Worksheet
A line plot is an ideal method to organize data. For example, if your child needs to arrange objects for easy recognition, draw a line plot. This worksheet can help teach the skill. Kids must identify correct pictures that display line plots.
What Is a Line Plot? Worksheet
Worksheet

Students Line Plot Worksheet
Help your students learn to draw a line plot correctly by giving real examples. In this exercise, they must check the data of a class of 18 students' heights (in inches). Have them compare two line plots and figure out which one is correct.
Students Line Plot Worksheet
Worksheet
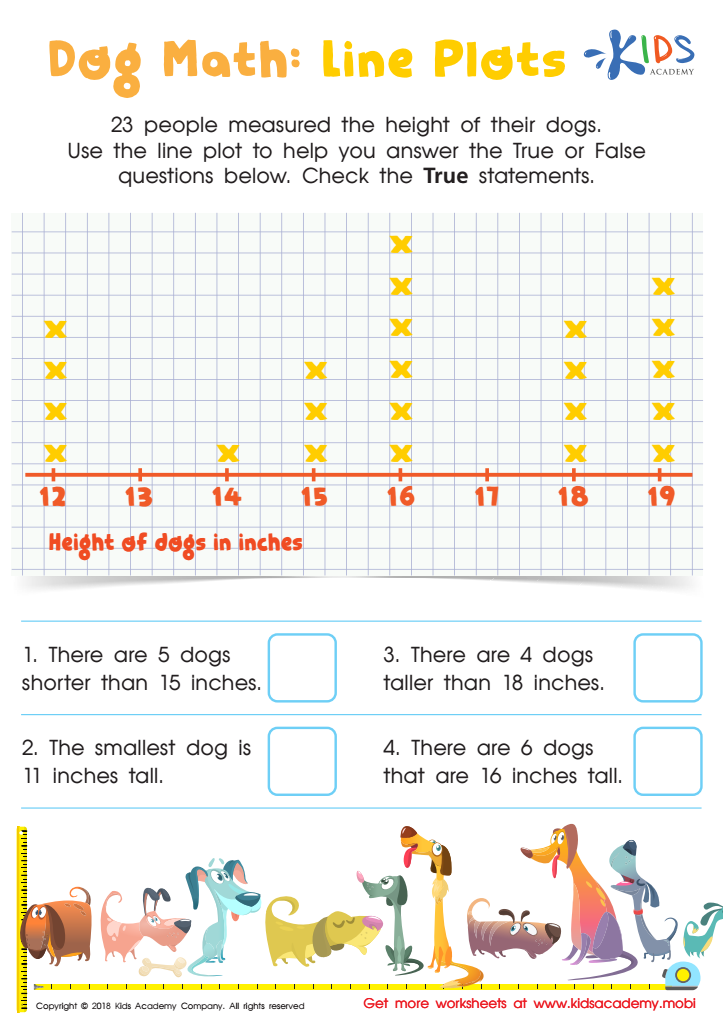
Dog Math: Line Plots Worksheet
Do your kids love dogs? If you have family pets, your kids may be excited to do this worksheet. It involves a line plot and True/False questions about 23 people measuring their dogs' heights. Assist your kids in verifying the statements that are True.
Dog Math: Line Plots Worksheet
Worksheet

Pencil Case Line Plot Worksheet
Explain to your child that a line plot is a way to organize information. For example, if they need to arrange objects, they should draw a line plot. Now, have them help Tom measure the objects in his pencil case in inches. Then, have them check the line plot that accurately shows the length.
Pencil Case Line Plot Worksheet
Worksheet

Line Plot Worksheet
Help your child measure presents with Santa using this 2nd grade line plot worksheet! It's a fun way to boost math skills and analyze data. Plus, it's sure to delight your child!
Line Plot Worksheet
Worksheet
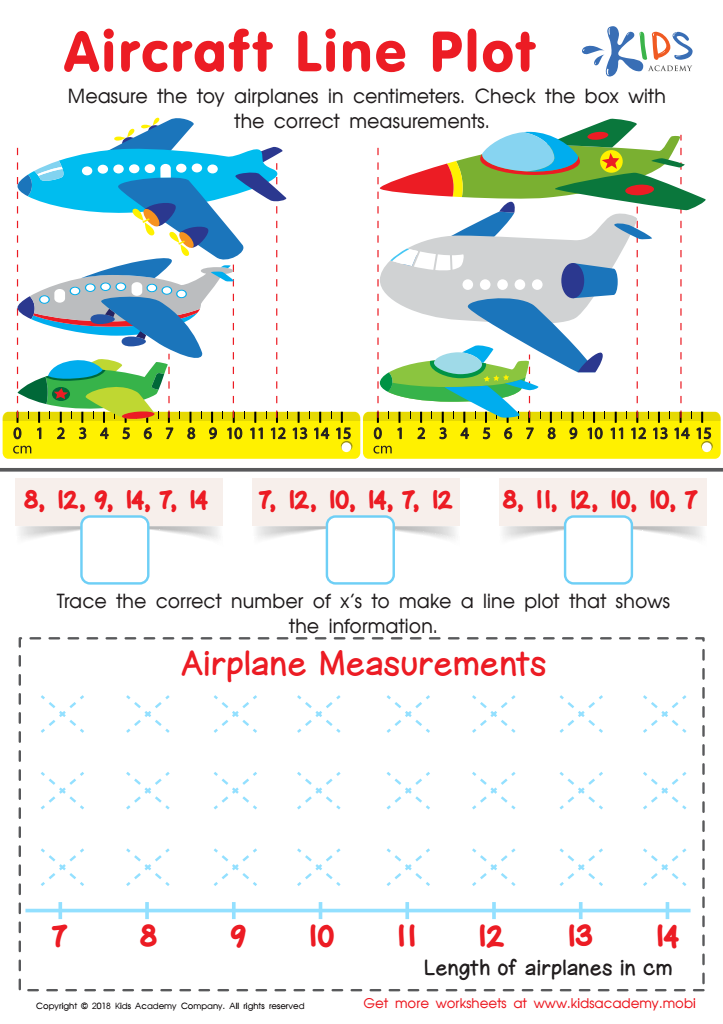
Aircraft Line Plot Worksheet
If your kids are aviation enthusiasts, they'll love this worksheet! Look at the picture with them, then ask them to measure the toy planes in cm. Check the box with the right measurements and then trace the x's to make a line plot with the data.
Aircraft Line Plot Worksheet
Worksheet

Family Line Plot Worksheet
Have you and your kids ever done a family height measurement? How did it go? If they're familiar with it, this worksheet may be simpler. The picture shows a family with their heights recorded. Get your kid to look at the line plots and choose the one that shows the family's heights accurately.
Family Line Plot Worksheet
Worksheet
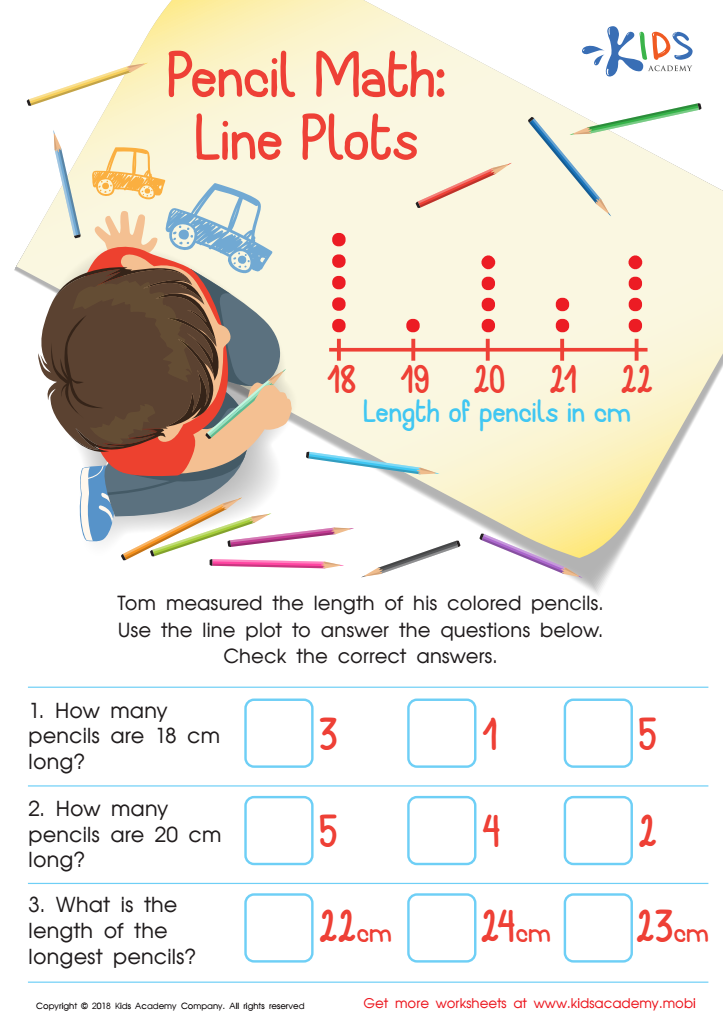
Pencil Math: Line Plots Worksheet
Your child will meet Tom in this worksheet, helping him find the length of his colored pencils. Tom has written the lengths in cm, and the line plot will help your kids answer the questions. Check the correct answers for each, including how many pencils are of a certain length. The line plot makes it easy to find the answers.
Pencil Math: Line Plots Worksheet
Worksheet
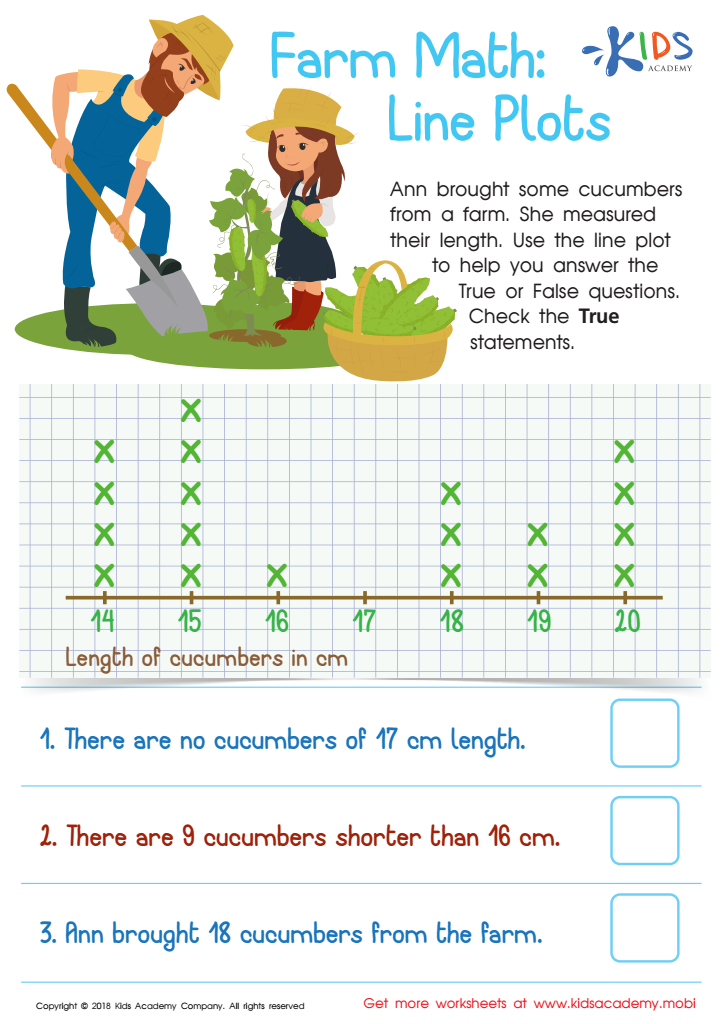
Farm Math: Line Plots Worksheet
Ann brought cucumbers from a farm and measured their length. She drew a line plot for your students to use to answer True/False questions about the number and length of the cucumbers. Ask your students to check only the True statements. (80 words)
Farm Math: Line Plots Worksheet
Worksheet
Join Kids Academy for Free
Who is primarily going to use this learning content?


Understanding line plots is essential for young learners aged 5-7 because it lays a critical foundation for their mathematical and analytical skills. At this age, children are naturally curious and capable of grasping basic data concepts through visual aids. Line plots are a simple, visual way to represent information and introduce young students to data collection, organization, and interpretation.
By learning to create and read line plots, children enhance their counting, comparison, and critical thinking abilities. For instance, they learn to count frequency, understand patterns, and make simple inferences based on presented data. These skills are not only vital for their future mathematical education but also applicable in everyday problem-solving situations.
Furthermore, engaging with line plots helps to develop vocabulary and language skills specific to describing data and quantities. Teachers and parents who integrate line plots into learning activities provide opportunities for children to ask questions, articulate findings, and reason logically about numerical information.
Moreover, early exposure to these concepts promotes confidence in handling more complex mathematical topics later on. Therefore, caring about and fostering an understanding of line plots in early education ensures that children build a robust foundation for future learning and a positive attitude towards mathematics.


