Interpreting data Worksheets for Ages 7-8
10 filtered results
-
From - To
Welcome to our "Interpreting Data Worksheets for Ages 7-8"! These engaging and educational worksheets are designed to help young learners develop essential skills in data interpretation. Children will explore various formats, including charts, graphs, and tables, to enhance their ability to read and understand data. Our fun and interactive activities encourage critical thinking and problem-solving, making learning enjoyable. Each worksheet is tailored to challenge young minds while ensuring they grasp fundamental concepts at an appropriate level. Whether in the classroom or at home, these resources are perfect for boosting confidence and fostering a love for mathematics. Start exploring today!
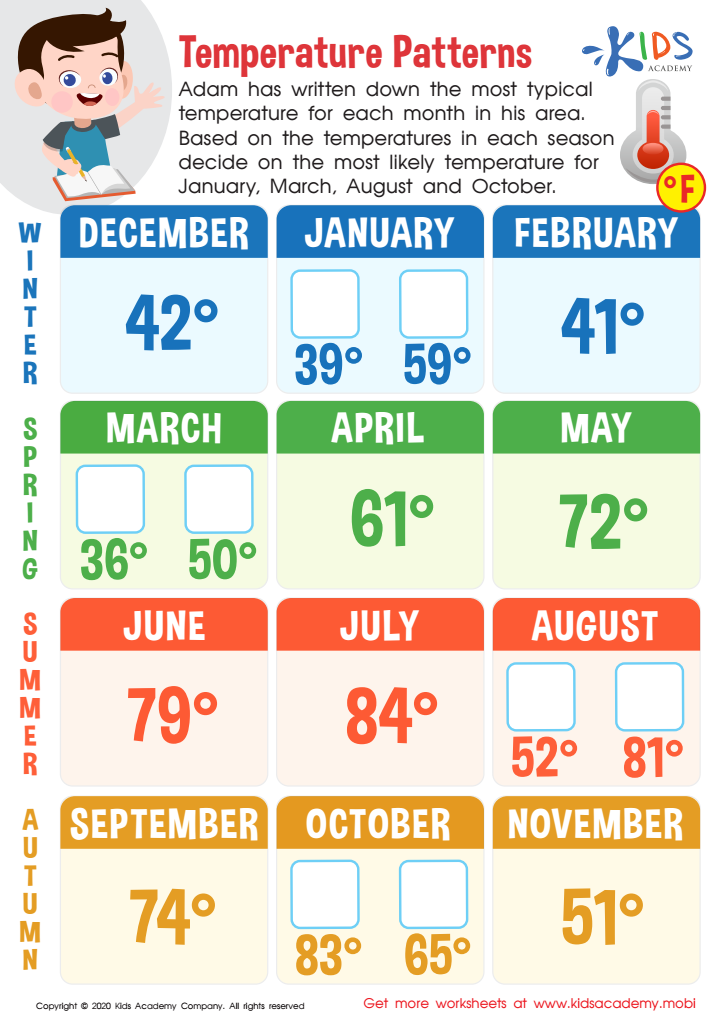
Temperature Patterns Worksheet
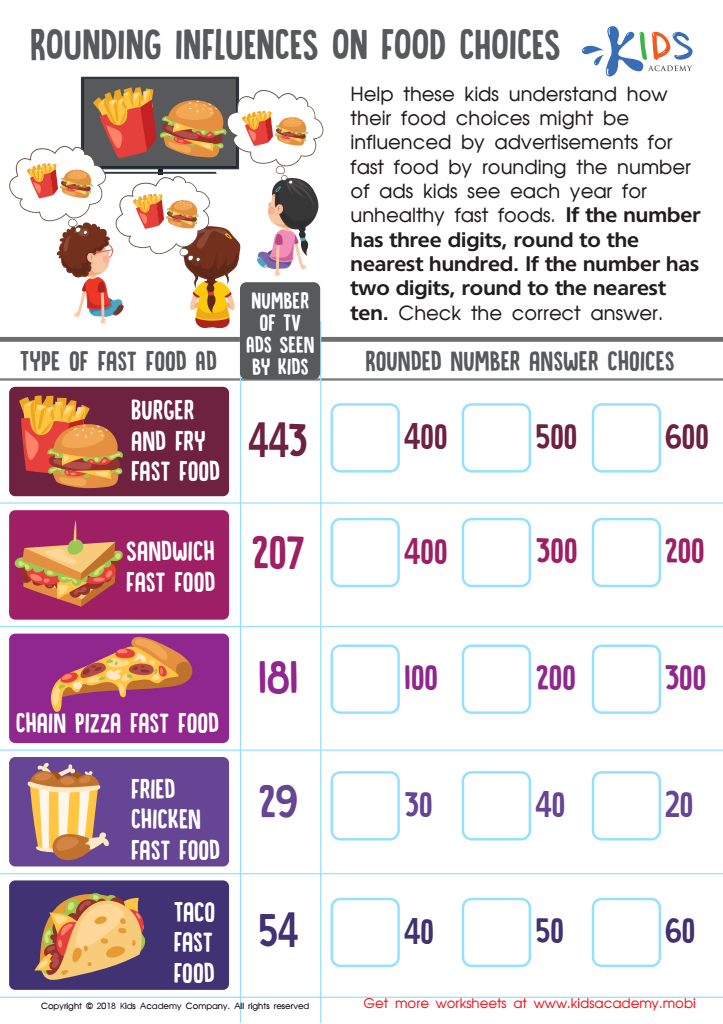
Rounding Influences Food Choices Worksheet

Interpret Line Plot Worksheet

Leaf Bar Graph Worksheet
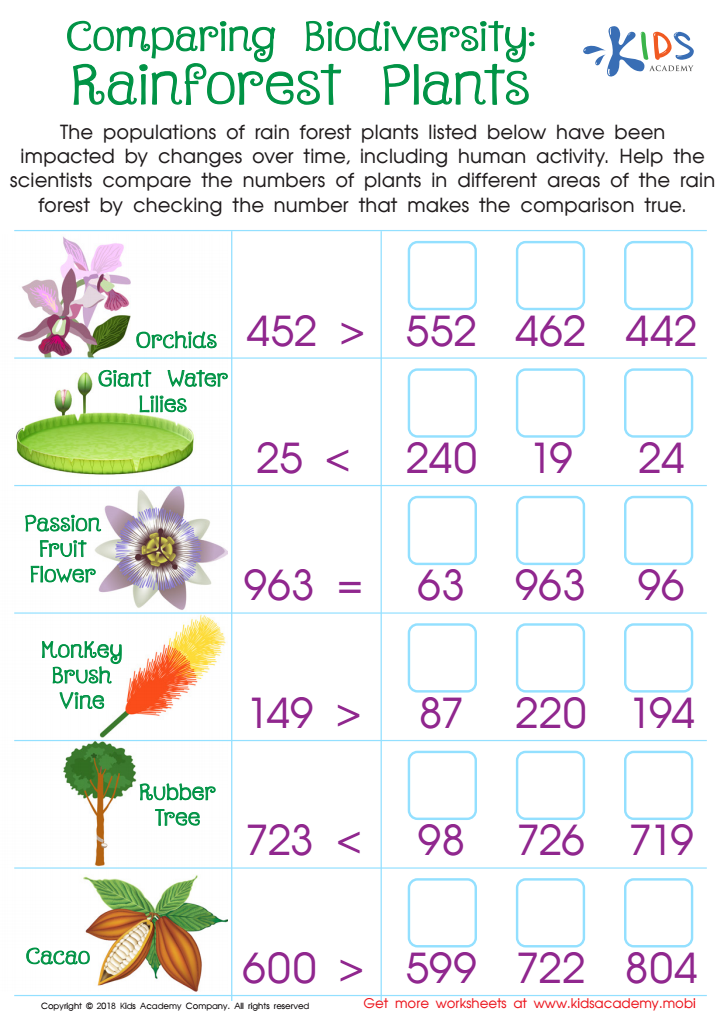
Comparing Biodiversity: Rainforest Plants Worksheet

Match Tally Marks to Bar Graphs Worksheet
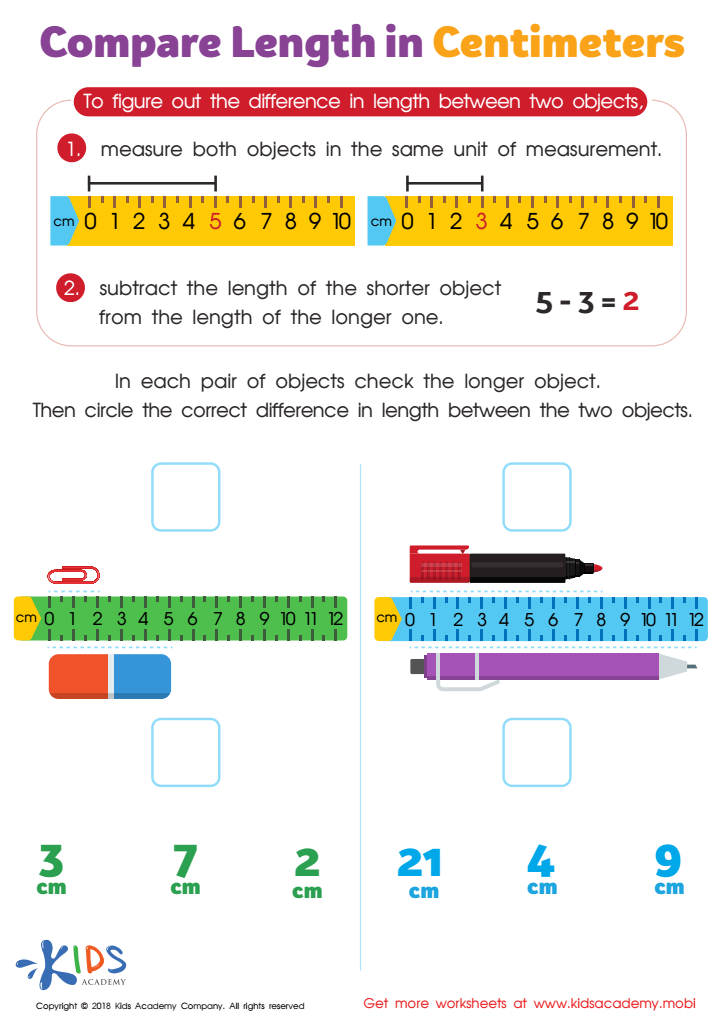
Compare Length in Centimeters Worksheet

Pencil Case Line Plot Worksheet
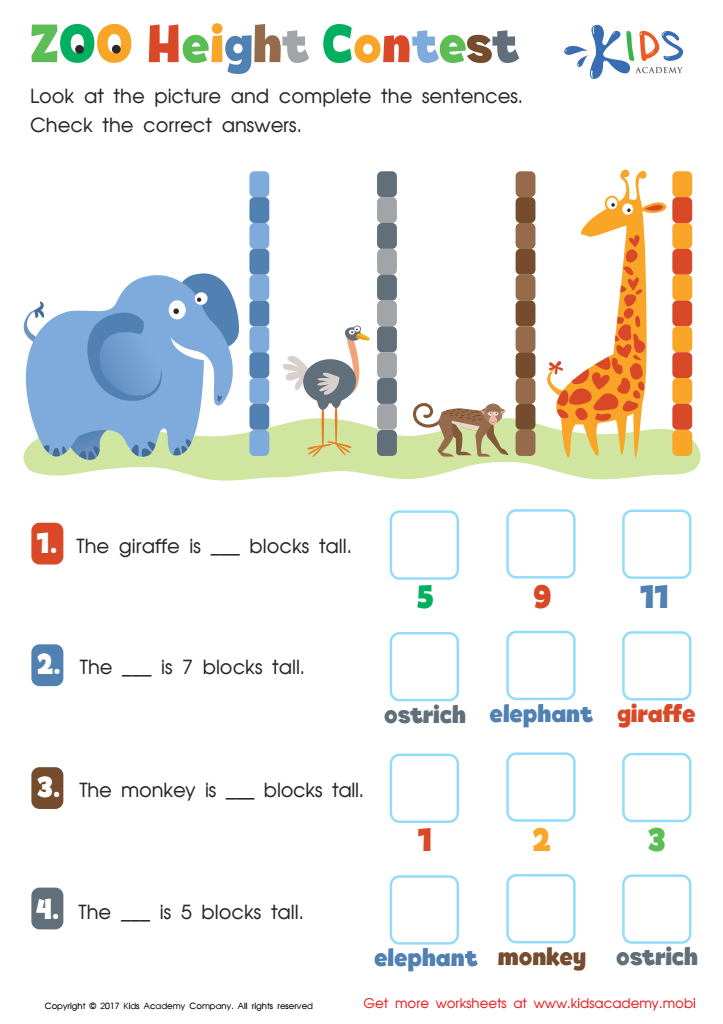
Zoo Height Contest Worksheet

Family Line Plot Worksheet


Interpreting data for children aged 7-8 is crucial for both parents and teachers as it lays the groundwork for critical thinking and informed decision-making. At this developmental stage, children begin to grasp basic mathematical concepts and reasoning skills, making it an ideal time to introduce them to data interpretation. By engaging with data related to their environment—such as weather patterns, sports statistics, or even their own academic progress—children learn how to analyze information, identify trends, and draw conclusions.
For parents, understanding how their children interpret data can help them support their learning at home. They can foster a curious mindset that encourages children to ask questions and explore further. For teachers, integrating data interpretation into the curriculum enhances classroom discussions, allowing students to become more engaged and active participants in their education. Furthermore, this skill supports the development of literacy through data sources such as graphs, charts, and surveys, contributing to a well-rounded educational experience.
Ultimately, caring about data interpretation empowers children to become informed citizens who can navigate a data-driven world responsibly. This early foundation fosters curiosity and resilience in problem-solving, skills that are essential in today’s fast-paced and information-rich society.


