Interpreting data Worksheets for Ages 8-9
7 filtered results
-
From - To
Discover our engaging "Interpreting Data Worksheets for Ages 8-9" designed to enhance young learners' analytical skills. These printable resources focus on essential concepts such as reading charts, graphs, and tables, empowering students to interpret and visualize data effectively. Our worksheets promote critical thinking and foundation-building in mathematics, making learning both fun and interactive. With a variety of exercises, your child will practice extracting information, comparing data sets, and making predictions. Perfect for classrooms or home learning environments, these worksheets stimulate curiosity and foster a deeper understanding of data interpretation. Equip your child with the skills they need for future academic success!
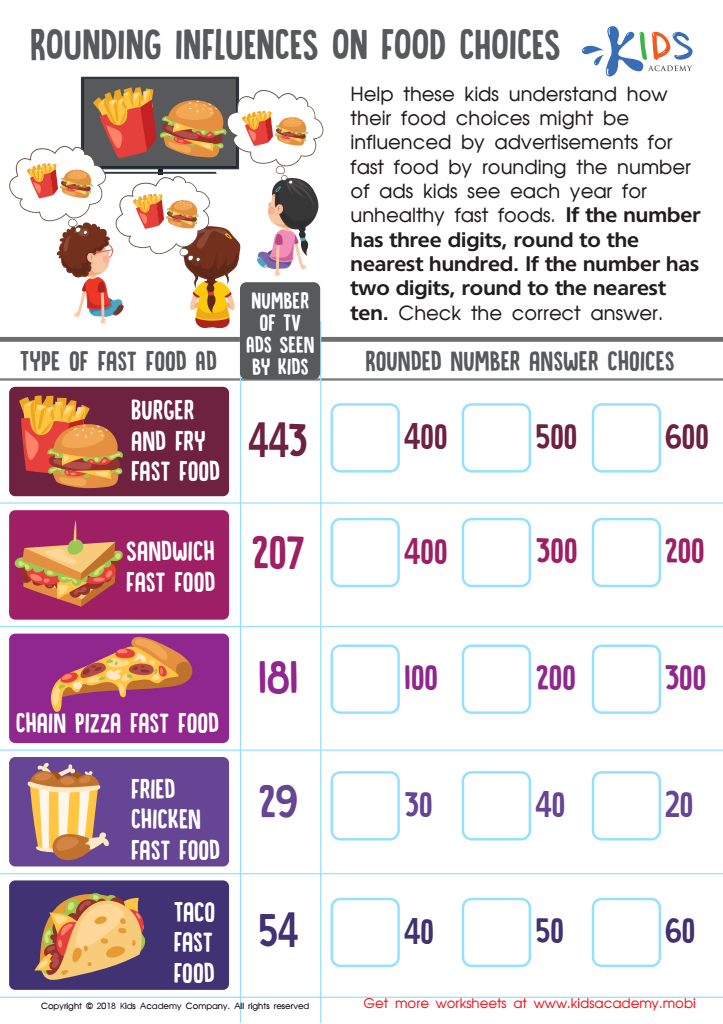
Rounding Influences Food Choices Worksheet

Interpret Line Plot Worksheet

Leaf Bar Graph Worksheet
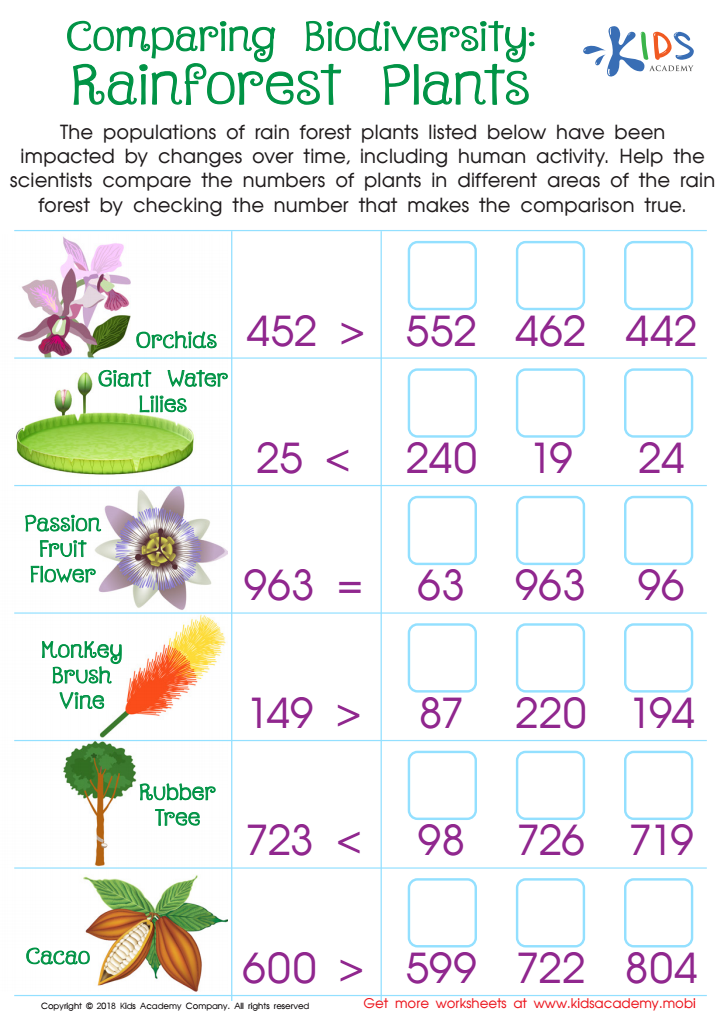
Comparing Biodiversity: Rainforest Plants Worksheet
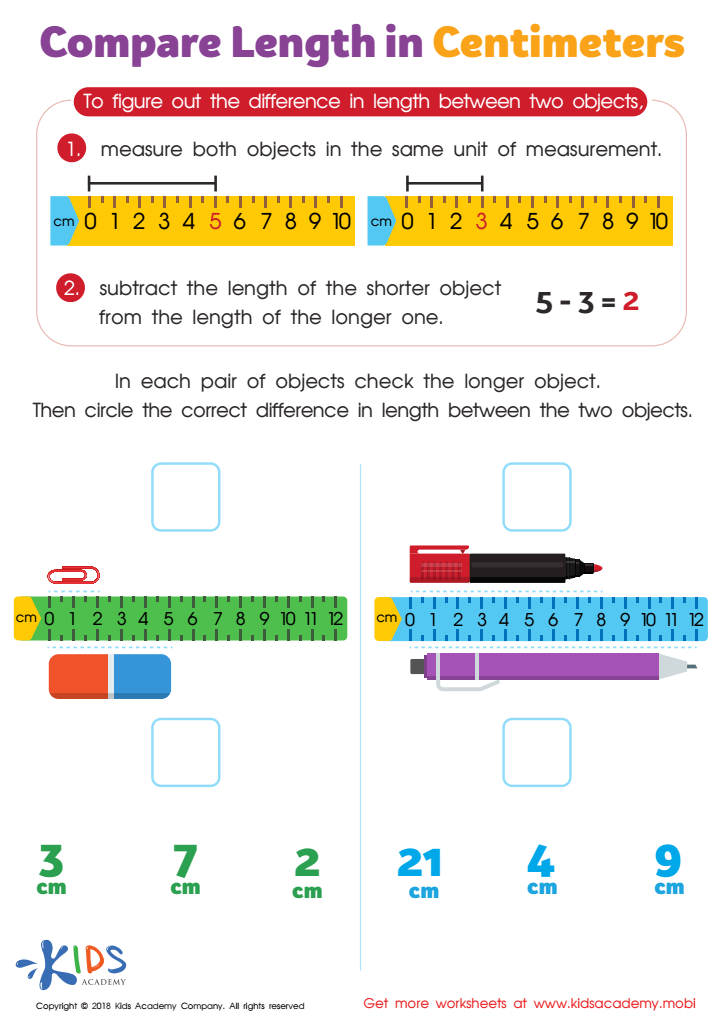
Compare Length in Centimeters Worksheet

Pencil Case Line Plot Worksheet

Family Line Plot Worksheet


Interpreting data for children aged 8 to 9 is crucial for parents and teachers as it lays the foundation for essential skills that are vital in today’s data-driven world. At this age, children are beginning to develop analytical thinking and problem-solving abilities. Understanding data encourages them to critically evaluate information, make informed decisions, and develop reasoning skills that will serve them in academics and everyday life.
Moreover, proficiency in interpreting data fosters mathematical literacy, a key component of the curriculum. As children are introduced to concepts like graphs, charts, and statistics, they learn how to convey information visually and derive meaning from numerical contexts. This skill not only aids in subjects like math and science but also enhances literacy by improving comprehension and analytical skills when reading texts that include statistical data.
Parents and teachers who emphasize the importance of data interpretation can motivate children to engage with subjects more deeply, enhancing their creativity and curiosity. By doing so, they prepare students to thrive in high school and beyond, where data literacy is increasingly important. Ultimately, fostering these skills at a young age equips children with necessary tools for future success in judgment, decision-making, and understanding the world around them.


