
Data interpretation Measurement Worksheets for Ages 8-9
9 filtered results
Difficulty Level
Grade
Age
-
From - To
Subject
Activity
Standards
Enhance your child’s mathematical skills with our Data Interpretation Measurement Worksheets for Ages 8-9. Specifically designed to strengthen critical thinking, these worksheets introduce concepts like data representation, measurement analysis, and graph interpretation. Engaging exercises help children grasp real-world applications of math, fostering proficiency in reading charts and graphs. Ideal for supporting classroom learning or enriching home study routines, our worksheets are crafted to challenge and motivate young learners. Boost their confidence, comprehension, and problem-solving abilities with our expertly designed resources. Visit Kids Academy to download and give your child the edge in mastering data interpretation!
Favorites
With answer key
Interactive

Reading Bar Graph Worksheet
Take your child north to practice data reading with a polar bear friend! This worksheet challenges 3rd graders to interpret data on a graph and solve related math problems.
Reading Bar Graph Worksheet
Worksheet

Fruit Math: Picture Graphs Worksheet
Help your child learn to draw graphs by having them look at pictures. Ask them to identify a graph that accurately portrays the data and have them explain why. This will prepare them to easily draw more complex graphs in the future. For example, have them look at the picture with the number of fruits in the colorful worksheet and explain why the graph is accurate.
Fruit Math: Picture Graphs Worksheet
Worksheet

Students Line Plot Worksheet
Help your students learn to draw a line plot correctly by giving real examples. In this exercise, they must check the data of a class of 18 students' heights (in inches). Have them compare two line plots and figure out which one is correct.
Students Line Plot Worksheet
Worksheet
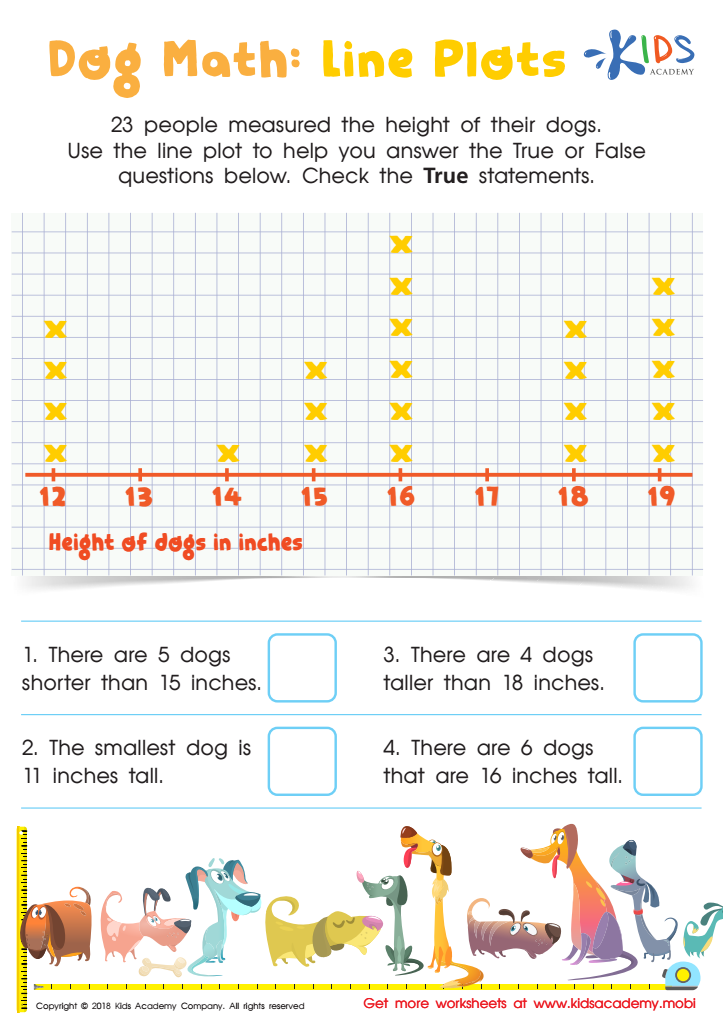
Dog Math: Line Plots Worksheet
Do your kids love dogs? If you have family pets, your kids may be excited to do this worksheet. It involves a line plot and True/False questions about 23 people measuring their dogs' heights. Assist your kids in verifying the statements that are True.
Dog Math: Line Plots Worksheet
Worksheet
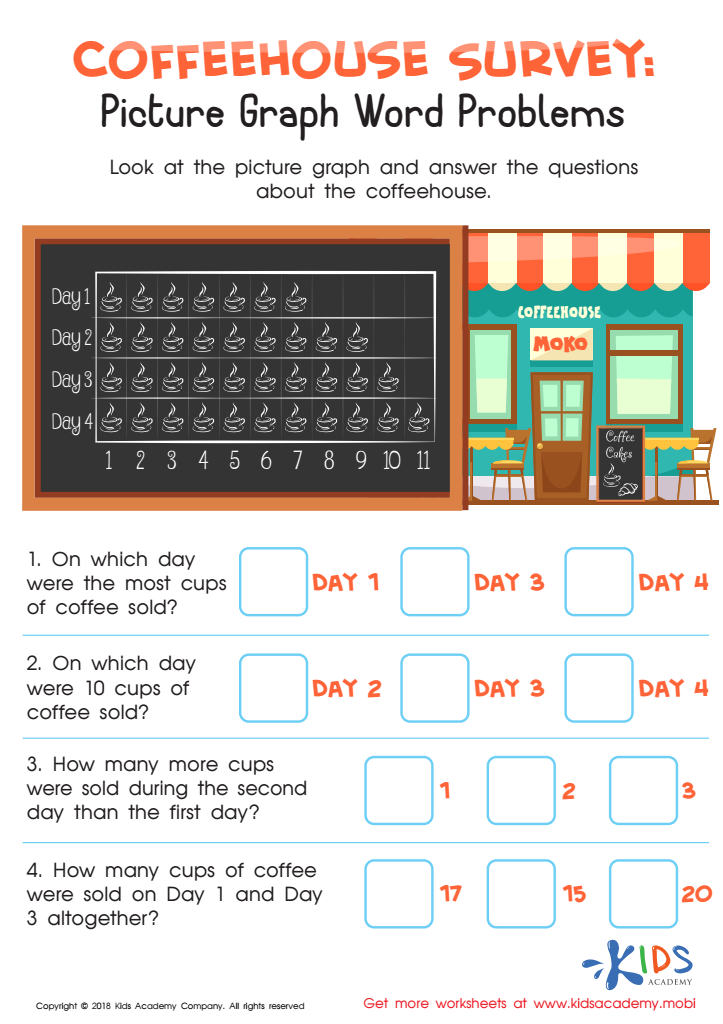
Coffeehouse Survey: Picture Graph Word Problems Worksheet
This coffeehouse survey helps children interpret pictures and answer questions. Your child will look at a picture graph displaying daily coffee cup sales from Day 1 to Day 4. Aid them in answering questions on the number of cups sold and which day had the most sales.
Coffeehouse Survey: Picture Graph Word Problems Worksheet
Worksheet

Line Plot Worksheet
Help your child measure presents with Santa using this 2nd grade line plot worksheet! It's a fun way to boost math skills and analyze data. Plus, it's sure to delight your child!
Line Plot Worksheet
Worksheet
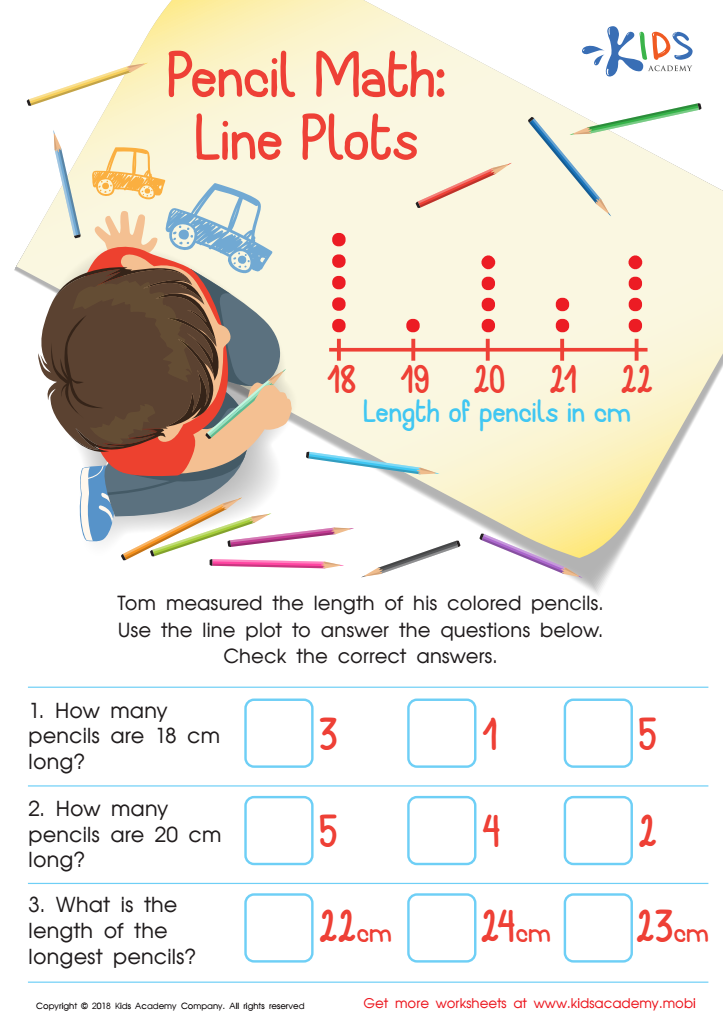
Pencil Math: Line Plots Worksheet
Your child will meet Tom in this worksheet, helping him find the length of his colored pencils. Tom has written the lengths in cm, and the line plot will help your kids answer the questions. Check the correct answers for each, including how many pencils are of a certain length. The line plot makes it easy to find the answers.
Pencil Math: Line Plots Worksheet
Worksheet
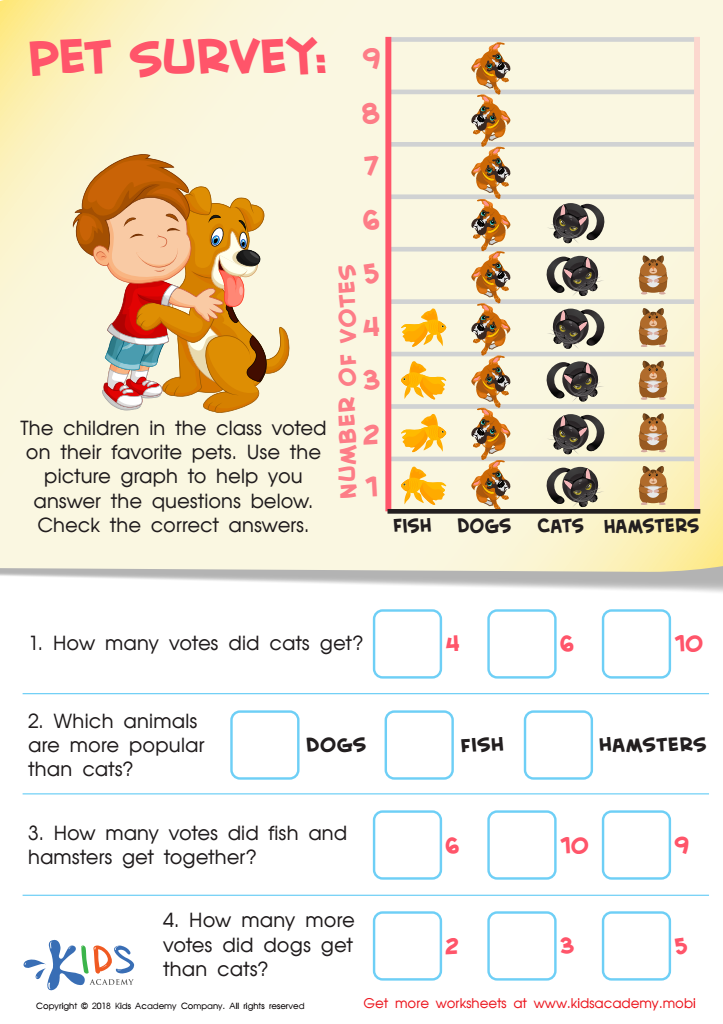
Pet Survey Worksheet
Do you have a furry family member? If the answer is yes and your kids love animals, they'll enjoy this worksheet. The picture graph shows the children's votes for their favorite pet - fish, dog, cat and hamster. Ask your child to use the graph to answer the questions. Guide them to check the right answer.
Pet Survey Worksheet
Worksheet
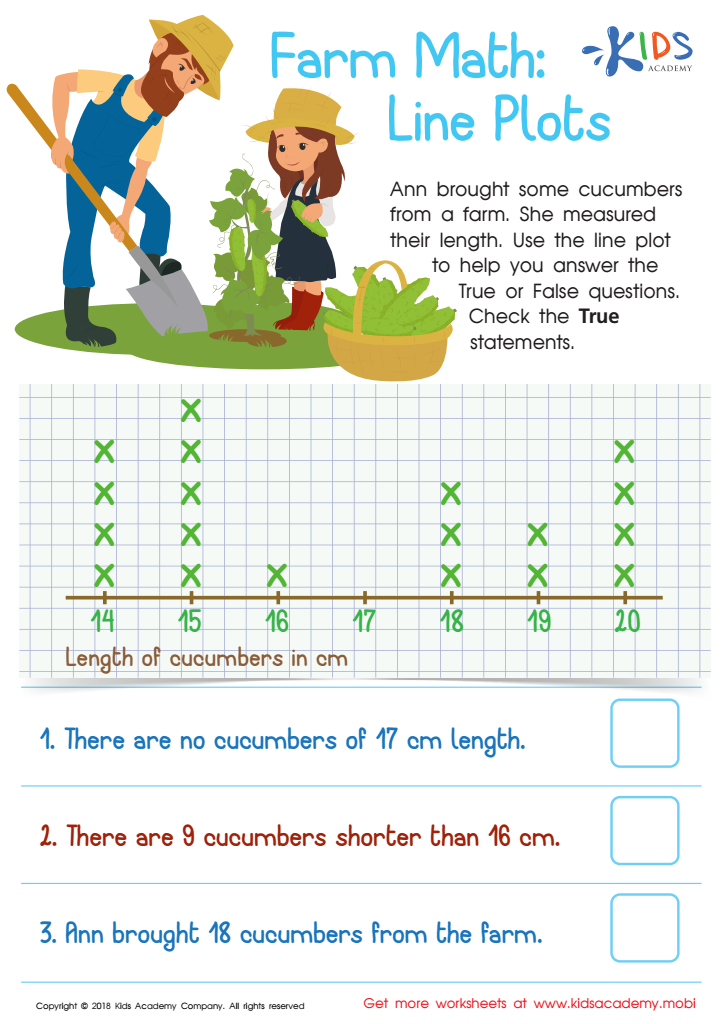
Farm Math: Line Plots Worksheet
Ann brought cucumbers from a farm and measured their length. She drew a line plot for your students to use to answer True/False questions about the number and length of the cucumbers. Ask your students to check only the True statements. (80 words)
Farm Math: Line Plots Worksheet
Worksheet
Join Kids Academy for Free
Who is primarily going to use this learning content?


Data interpretation and measurement are fundamental skills that play a crucial role in the cognitive development of children ages 8-9. At this age, children are beginning to grasp more complex concepts in mathematics and science, and understanding how to process and interpret data sets the stage for future academic success.
For parents and teachers, focusing on these skills aids in developing a child's ability to reason logically and think critically. When children learn how to measure objects accurately and interpret data, they become adept at identifying patterns and making evidence-based conclusions, which is beneficial not just in academics but in real-life decision-making.
Moreover, these skills contribute significantly to fostering problem-solving abilities. Whether it’s in a science project measuring plant growth, using bar graphs to display survey results, or comparing data in social studies—data interpretation and measurement teach children how to apply their knowledge contextually.
Introducing these concepts early also builds a solid foundation for STEM education (Science, Technology, Engineering, Mathematics), encouraging curiosity and better preparing children for advanced subjects in higher grades. In summary, parents and teachers should prioritize these skills to enrich a child's educational journey, nurturing critical thinkers equipped with essential tools for lifelong learning.


