Extra Challenge Graphs Worksheets for Ages 3-6
3 filtered results
-
From - To
Introduce your little learners to the world of data representation with our "Extra Challenge Graphs Worksheets for Ages 3-6"! These engaging and age-appropriate worksheets are designed to enhance early math skills by familiarizing children with different types of graphs, such as bar graphs and pictographs. Each worksheet provides fun and interactive exercises that promote critical thinking, pattern recognition, and basic analytical skills. Perfect for preschoolers and kindergartners, these resources make learning enjoyable while reinforcing essential math concepts. Help your child develop a strong foundation in graphing and data analysis with our captivating worksheets that seamlessly blend education and play!
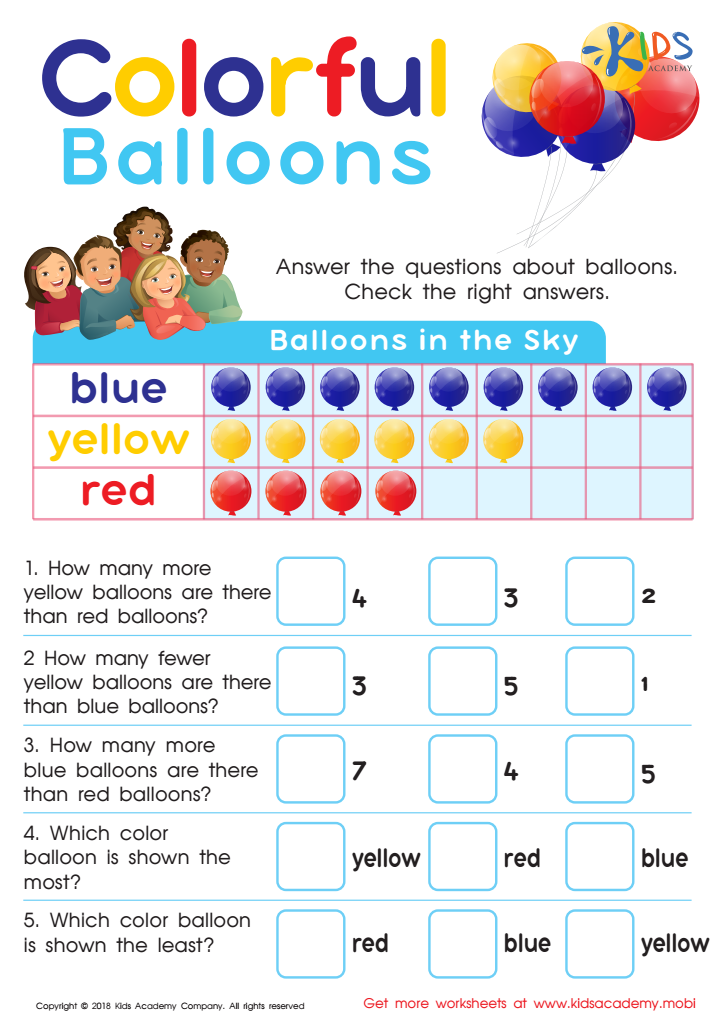
Picture Graphs: Colorful Balloons Worksheet
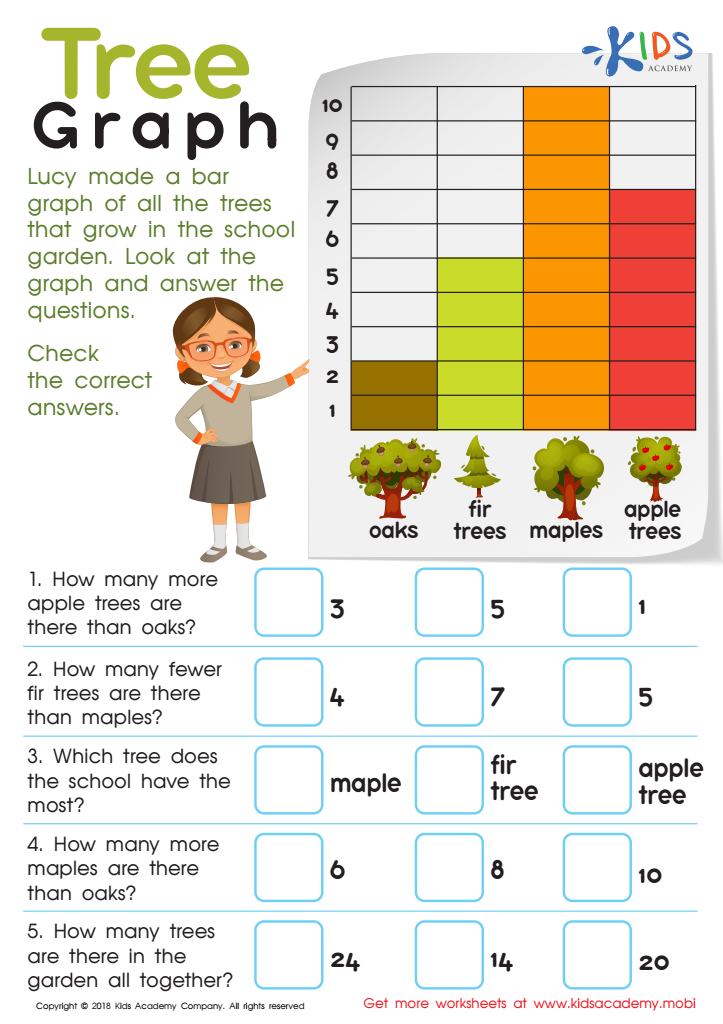
Tree Graph Worksheet

Match Tally Marks to Bar Graphs Worksheet


Extra Challenge Graphs for ages 3-6 are invaluable tools for parents and teachers as they promote critical cognitive and social skills essential for early childhood development. First and foremost, these graphs encourage young learners to engage in problem-solving and analytical thinking. By visualizing information, children not only learn to classify and organize data but also enhance their understanding of relationships and patterns in a fun and engaging manner.
Furthermore, these graphs foster communication skills. Children articulate their thoughts and observations about the data, enhancing their vocabulary and verbal reasoning. Additionally, Extra Challenge Graphs provide a platform for collaborative learning, where teamwork among peers leads to shared discoveries and develops social skills.
Moreover, incorporating these graphs into daily activities makes learning more interactive and enjoyable, encouraging a love for numbers and quantitative reasoning from an early age. For parents and teachers, this means children are better prepared for more complex mathematical concepts in the future.
Understanding the value of Extra Challenge Graphs equips adults to support children's learning effectively, paving the way for holistic development that lays a strong foundation for lifelong learning. Thus, embracing these tools is an investment in children’s future success.


