Extra Challenge Graphs Worksheets for Ages 3-9
15 filtered results
-
From - To
Discover our "Extra Challenge Graphs Worksheets" designed for children aged 3-9! Our engaging worksheets provide young learners with an opportunity to explore and master graphing concepts through fun and interactive activities. Ideal for boosting critical thinking and analytical skills, these worksheets cover a variety of graph types and challenges tailored to different age groups. Whether your child is learning the basics of pictographs or tackling more complex bar graphs, our resources empower them to practice at their own pace. Perfect for classroom use or at-home learning, these worksheets make mastering math concepts enjoyable and exciting!
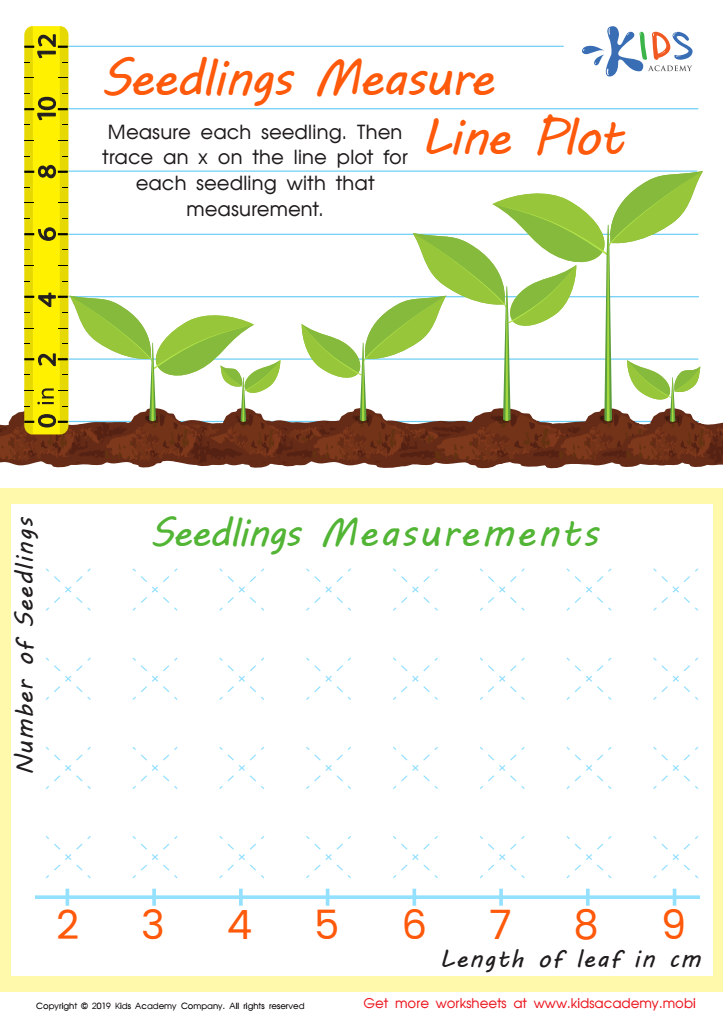
Seedling Measure Line Plot Worksheet

Recycling Picture Graph Worksheet

Planets Bar Graph Worksheet

Interpret Line Plot Worksheet
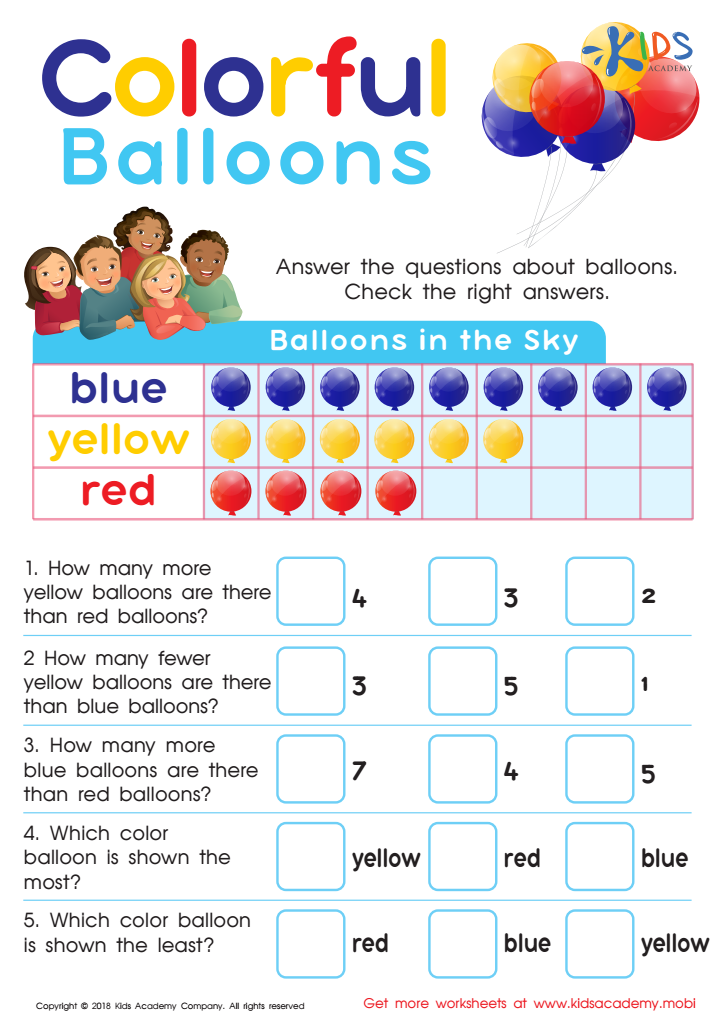
Picture Graphs: Colorful Balloons Worksheet
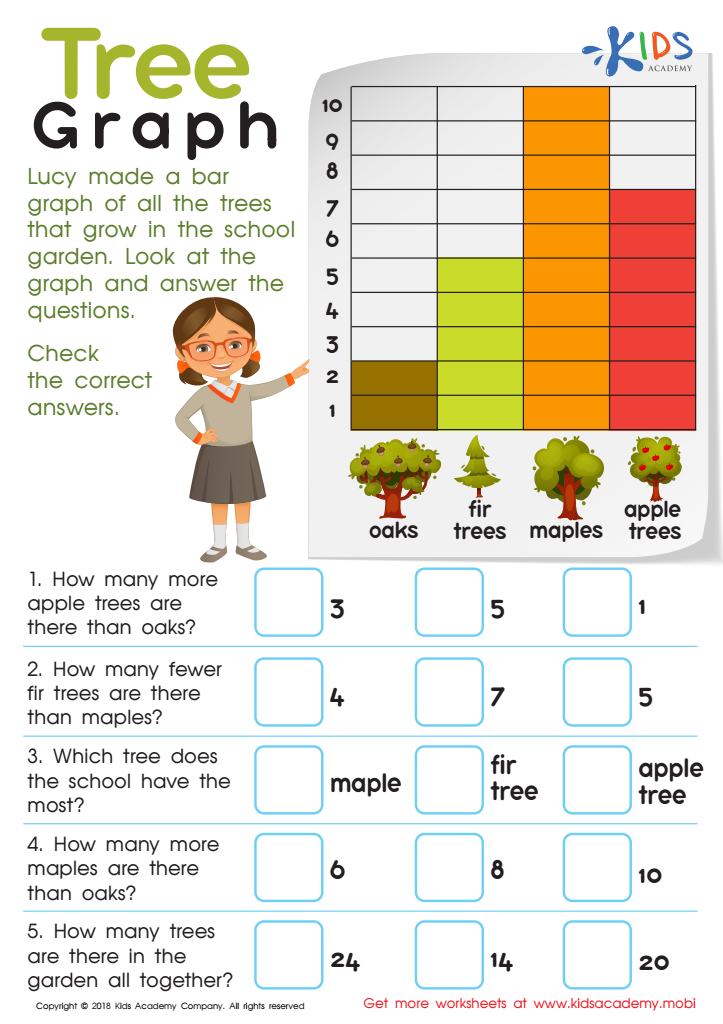
Tree Graph Worksheet

Taxi Math Worksheet

Leaf Bar Graph Worksheet

Match Tally Marks to Bar Graphs Worksheet

Swim Race Line Plot Worksheet
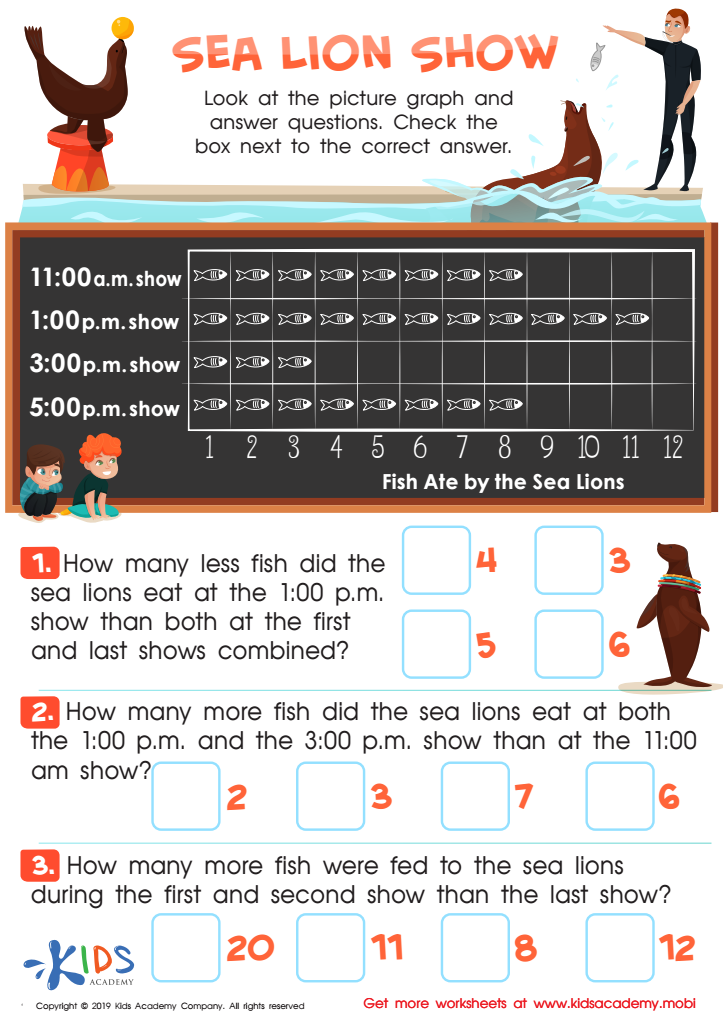
Sea Lion Show Worksheet
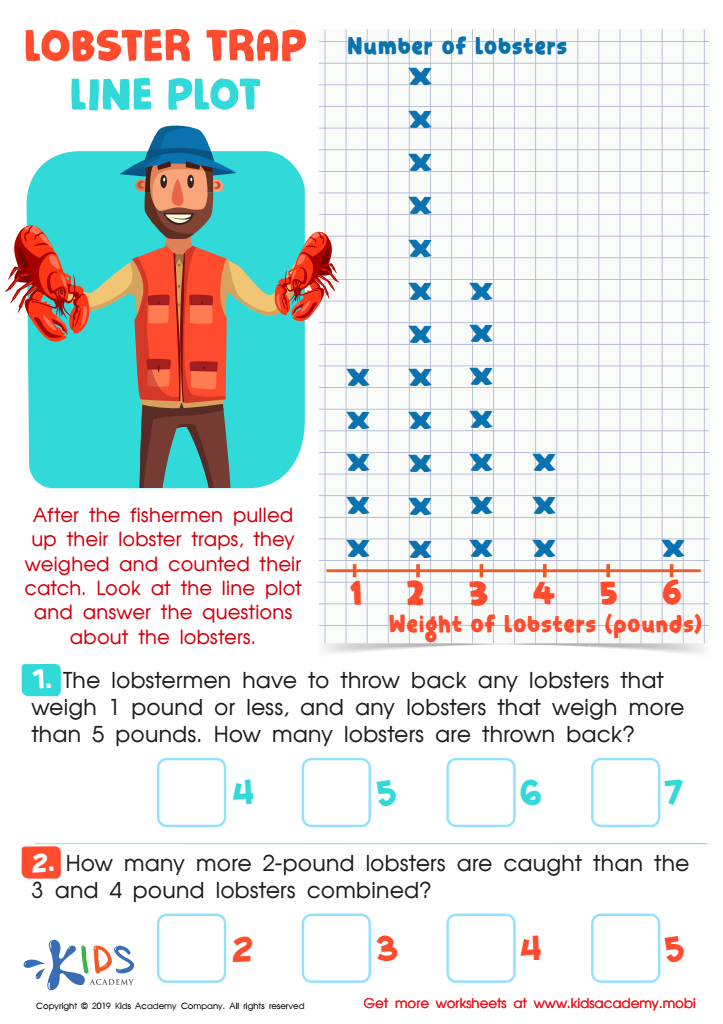
Lobster Trap Line Plot Worksheet
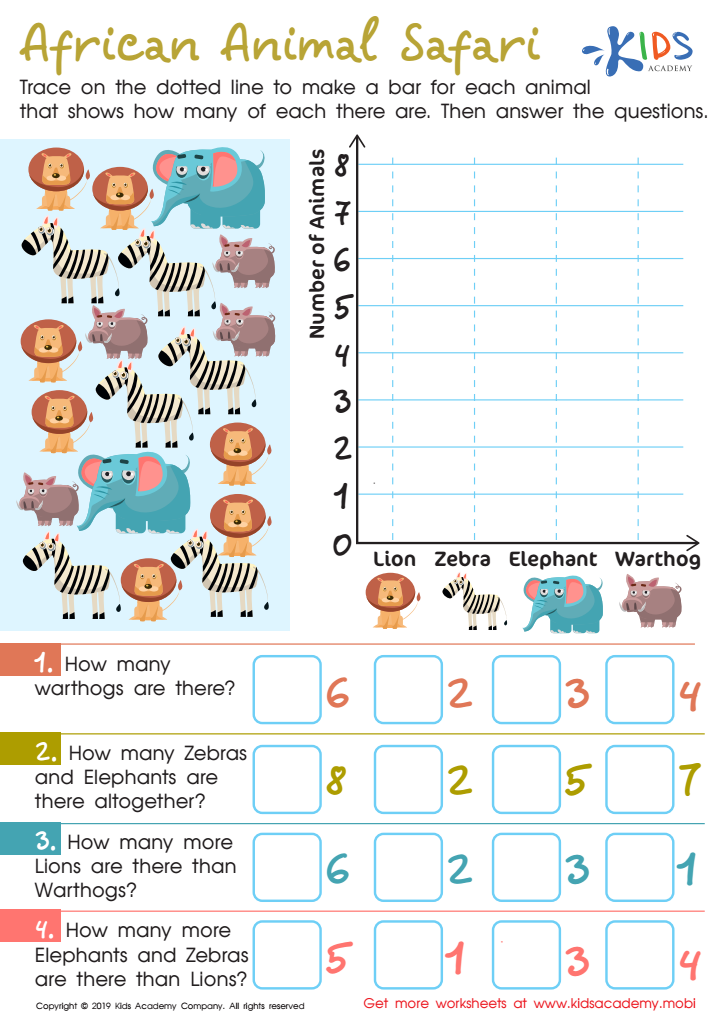
African Animal Safari Worksheet

Leaf Measure Line Plot Worksheet

Football Math Worksheet


Extra Challenge Graphs for Ages 3-9 are invaluable tools for both parents and teachers, as they significantly enhance children's learning experiences. These graphs offer a visual representation of concepts, aiding young learners in organizing their thoughts and making connections in a concrete manner. By incorporating graphs into early education, children can develop crucial critical thinking and problem-solving skills early on, which are foundational for future academic success.
Moreover, Extra Challenge Graphs encourage student engagement and creativity. They inspire children to explore beyond their syllabus, fostering a sense of curiosity and excitement about learning. Teachers can utilize these graphs to tailor lessons to individual needs, ensuring that every child is challenged appropriately and remains motivated. This differentiation is key to preventing boredom and encouraging a love for learning.
Additionally, parents can engage with their children at home using these graphs, promoting collaborative learning experiences. This active participation not only strengthens understanding but also enhances parent-child communication regarding educational content. Ultimately, Extra Challenge Graphs serve as more than just academic tools; they are a means to cultivate a lifelong appreciation for knowledge and a positive attitude towards challenges, making them essential for both parents and educators.


