Extra Challenge Graphs Worksheets for 9-Year-Olds
10 filtered results
-
From - To
Introducing our "Extra Challenge Graphs for 9-Year-Olds" - the perfect tool for young learners craving a bit more from their math experience! Designed specifically for 9-year-olds, these worksheets offer a unique and engaging way to deepen their understanding of graphs. Through a series of thought-provoking exercises, students will explore various types of graphs, enhance their analytical skills, and tackle problems that challenge their comprehension. Each worksheet is crafted to not only support their current curriculum but also to ignite a passion for mathematics. Dive into our Extra Challenge Graphs and watch your child's confidence and capabilities soar!
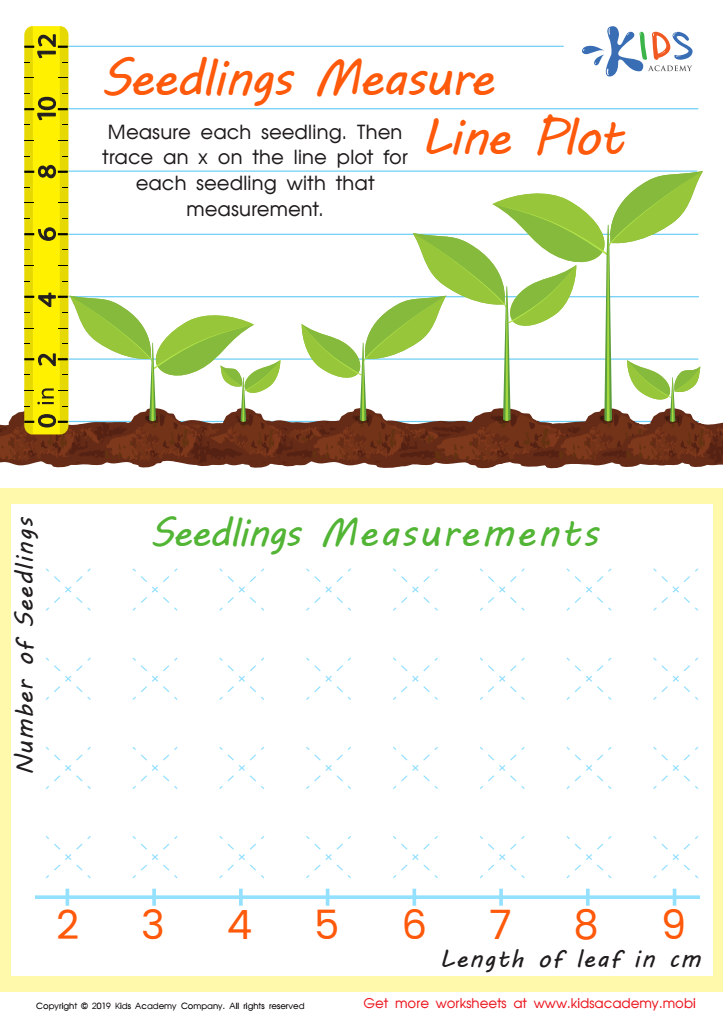
Seedling Measure Line Plot Worksheet

Recycling Picture Graph Worksheet

Planets Bar Graph Worksheet

Interpret Line Plot Worksheet

Taxi Math Worksheet

Leaf Bar Graph Worksheet

Swim Race Line Plot Worksheet
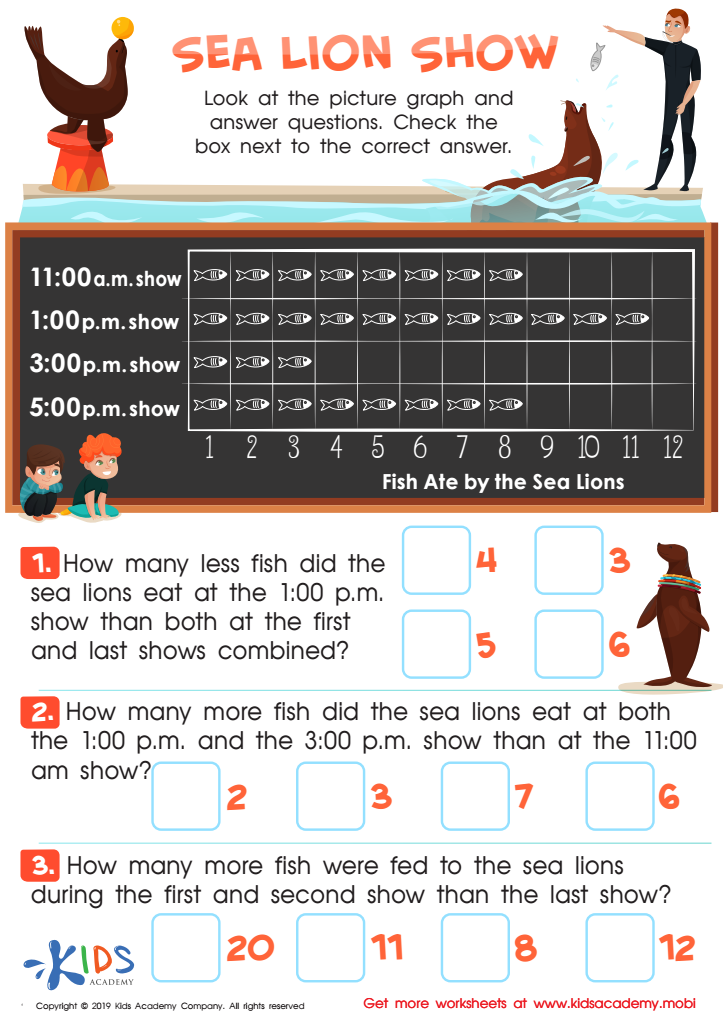
Sea Lion Show Worksheet
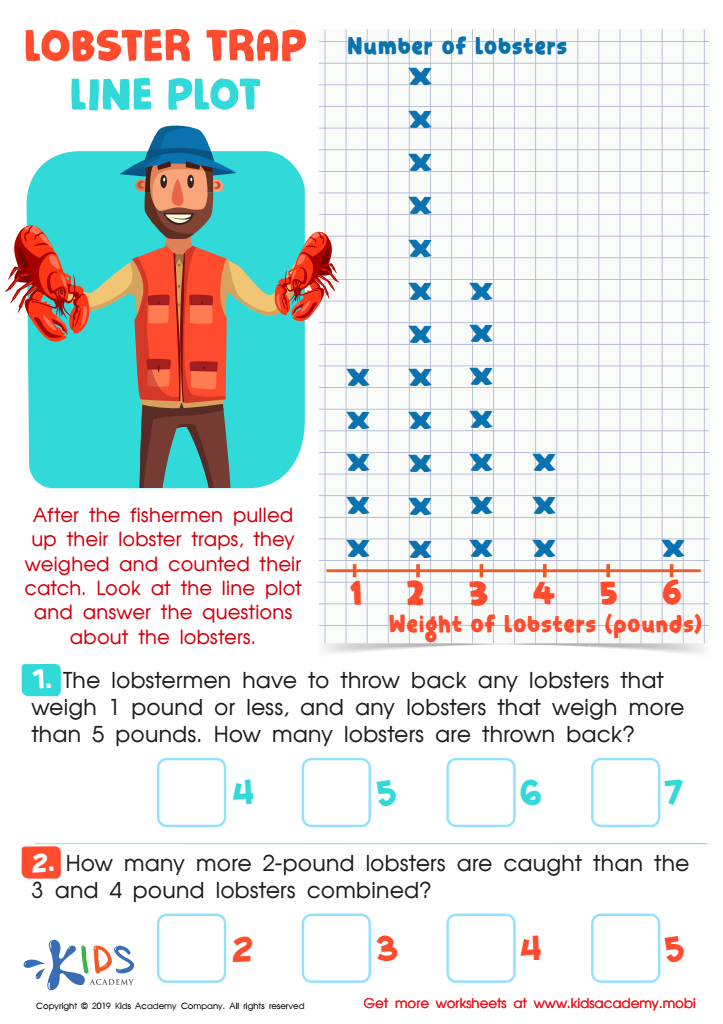
Lobster Trap Line Plot Worksheet

Leaf Measure Line Plot Worksheet


Extra Challenge Graphs for 9-Year-Olds offer a unique opportunity for children to enrich their understanding of mathematical concepts through engaging, thought-provoking problems. These worksheets are not just ordinary tasks; they are carefully designed to push students beyond their comfort zones, encouraging them to explore the fascinating world of graphs in more depth. At the age of 9, children are at a pivotal stage in their cognitive development, making it the perfect time to introduce these extra challenges that foster critical thinking, problem-solving, and analytical skills.
These worksheets present graphs in various forms – from bar graphs to pie charts and line plots, providing a comprehensive approach to learning how information can be represented visually. Such diversity in presentation helps children to appreciate the versatility of graphs in everyday life, be it in understanding weather patterns, tracking sports scores, or comparing class test scores.
Moreover, Extra Challenge Graphs for 9-Year-Olds are designed to be fun and interactive. They include real-life scenarios that children can relate to, making the learning process enjoyable and relevant. By tackling these extra challenges, children not only boost their mathematical prowess but also gain confidence in their abilities to solve complex problems, laying a solid foundation for future academic success in mathematics and beyond.


