Data interpretation Extra Challenge Worksheets for Ages 4-8
4 filtered results
-
From - To
Boost your child's analytical skills with our "Data Interpretation Extra Challenge Worksheets for Ages 4-8." Designed to engage young minds, these worksheets provide hands-on activities that make learning fun! Children will explore patterns, graphs, and charts through colorful visuals and thought-provoking questions. Tailored specifically for early learners, these challenges encourage critical thinking and problem-solving while reinforcing essential math concepts. Ideal for at-home practice or classroom use, our worksheets will inspire curiosity and confidence in your child. Check out our variety of levels to ensure your little one is both challenged and supported on their educational journey!

Reading Bar Graph Worksheet

Making a Graph: Creepy Crawlies Worksheet
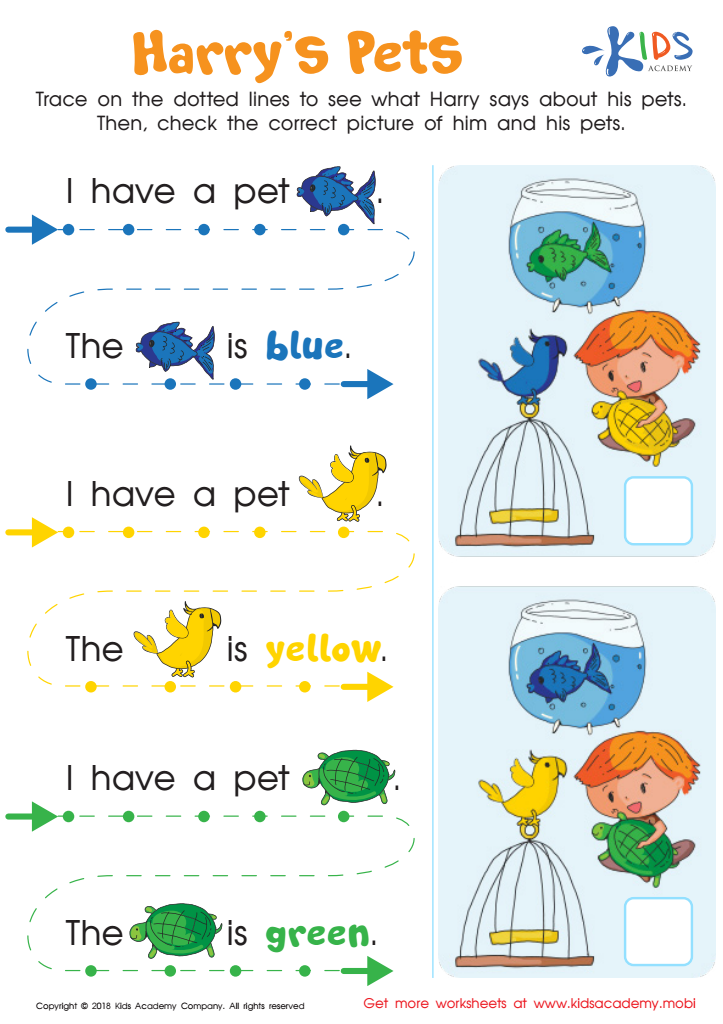
Read from Left to Right: Harry's Pets Worksheet

Leaf Measure Line Plot Worksheet


Data interpretation is a crucial skill that strengthens critical thinking, problem-solving, and decision-making abilities in young learners. For children aged 4-8, engaging with data in an interactive and fun way can lay the groundwork for future academic success. Parents and teachers should care about data interpretation for several reasons.
Firstly, it promotes analytical skills. Children learn to observe, categorize, and analyze information, fostering logical reasoning from an early age. This enhances their ability to make connections and understand the world around them.
Secondly, data interpretation encourages communication skills. As children discuss their findings or share stories about data, they improve their ability to express ideas clearly, work collaboratively, and engage in constructive debates.
Moreover, incorporating data tasks in everyday activities makes learning relevant and applicable. Whether they are counting apples during a grocery trip or charting the weather, children grasp essential concepts through practical experiences.
Finally, instilling a love for data exploration can encourage curiosity and resilience. As children tackle “extra challenge” activities, they build confidence in facing difficulties and discovering solutions.
In summary, investing time in teaching data interpretation can cultivate a generation of informed, thoughtful, and innovative individuals.


