Extra Challenge Graphs Worksheets for Ages 4-7
5 filtered results
-
From - To
Enhance your child's analytical skills with our "Extra Challenge Graphs Worksheets for Ages 4-7". Tailored for young learners, these engaging and educational worksheets introduce kids to the basics of graphs through fun activities. From simple bar graphs to pictographs, these exercises help develop creativity, critical thinking, and attention to detail. Each worksheet is designed to be age-appropriate and challenging, encouraging children to count, sort, and interpret data. Perfect for classroom learning or extra practice at home, our collection makes mastering graphs enjoyable and rewarding. Help your child build a strong math foundation today!

Match Tally Marks to Bar Graphs Worksheet
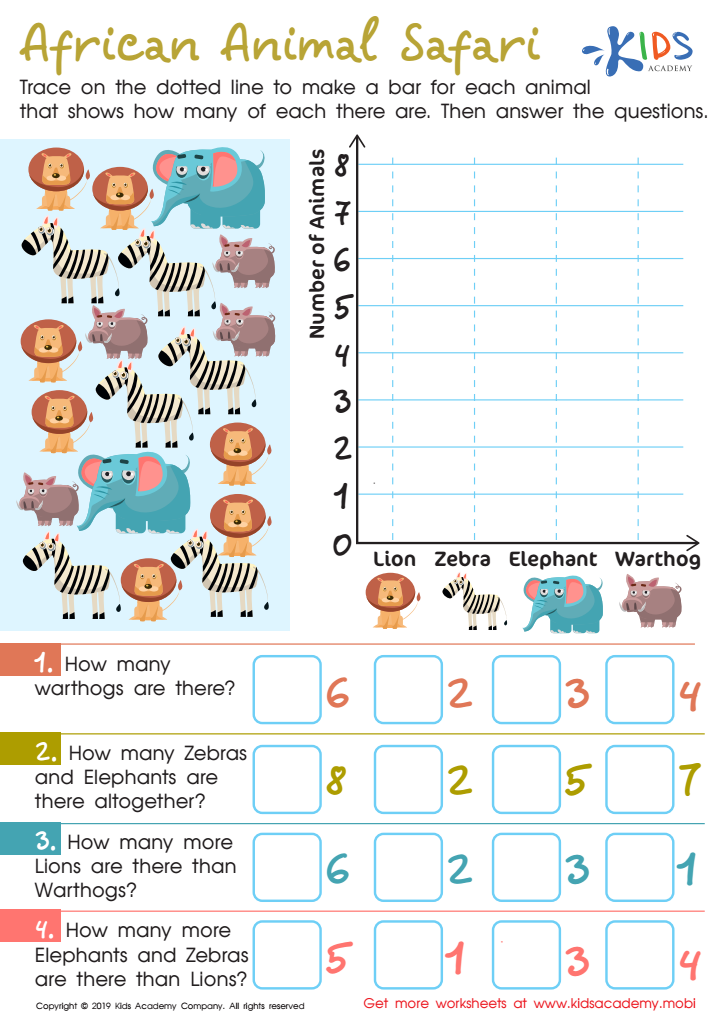
African Animal Safari Worksheet
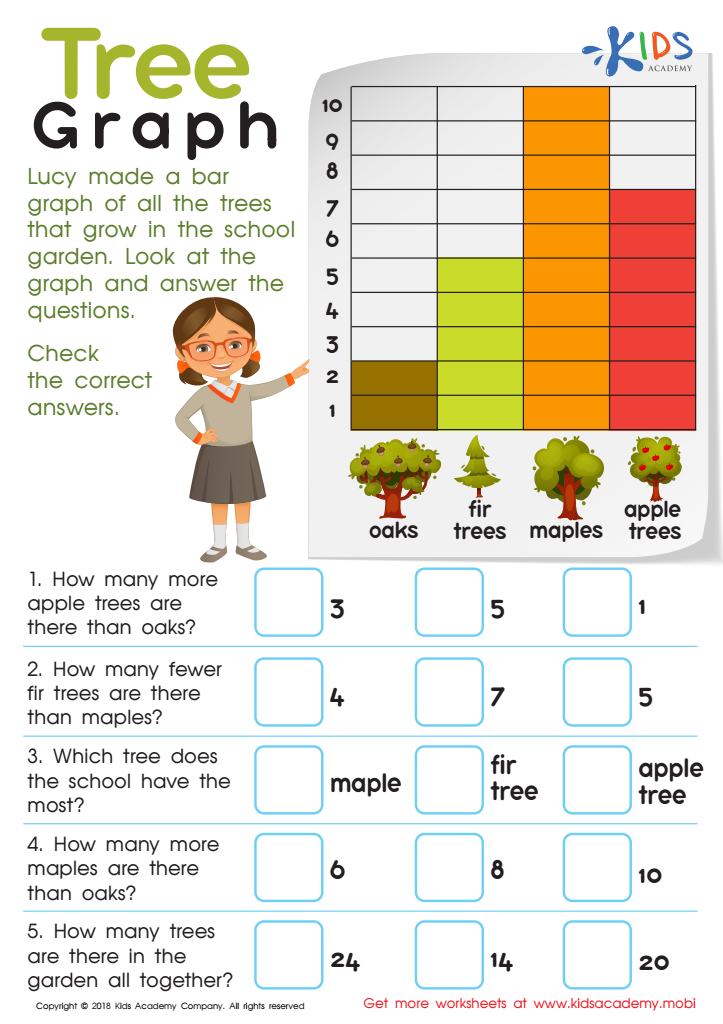
Tree Graph Worksheet
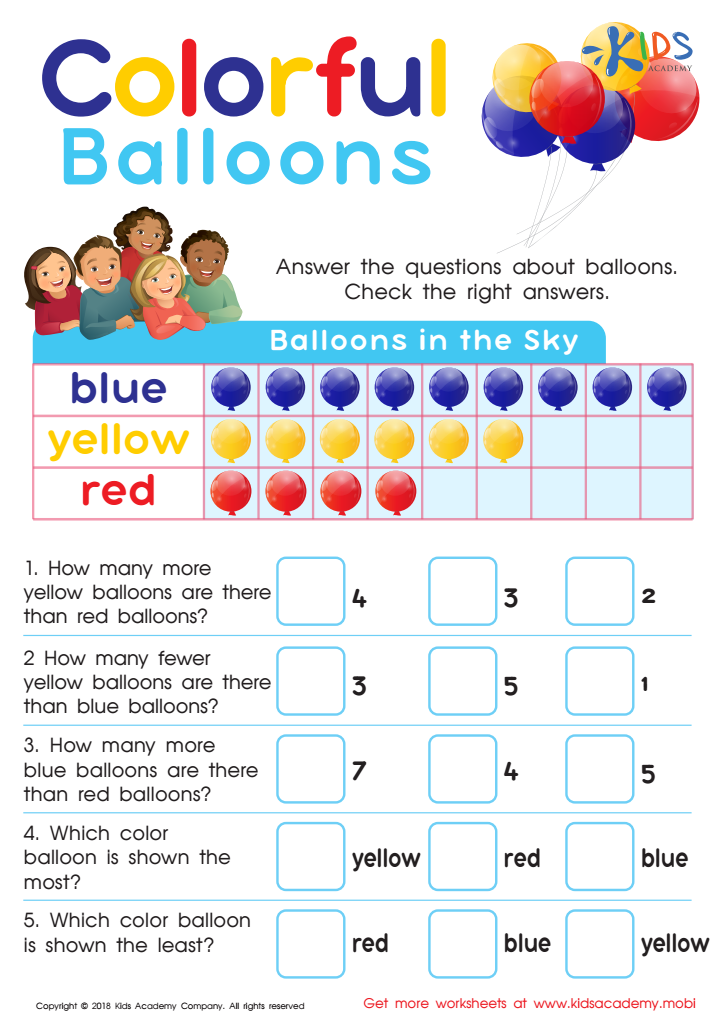
Picture Graphs: Colorful Balloons Worksheet

Football Math Worksheet


Extra Challenge Graphs for ages 4-7 are tools designed to introduce young children to the basics of data representation and critical thinking. Parents and teachers should care about these resources for several reasons:
-
Foundational Skills: Early exposure helps children grasp fundamental math concepts, such as counting, comparing quantities, and understanding relationships between different sets of data.
-
Engagement: These graphs can make abstract concepts more tangible and engaging for young learners. Using colorful, visual representations captures children’s interest and encourages participation.
-
Critical Thinking: By interpreting simple graphs, children learn to analyze information, recognize patterns, and draw conclusions. These cognitive skills are crucial across all areas of learning.
-
Interdisciplinary Learning: Extra Challenge Graphs can integrate subjects like math, science, and art. For example, children can collect data from science experiments and represent it graphically, enhancing their overall learning experience.
-
Language Development: Discussing graphs promotes vocabulary related to math and analysis. Describing what they see enhances children’s ability to articulate their understanding of quantitative information.
-
Problem-solving: Engaging with problems that require creating or interpreting graphs fosters problem-solving skills. Children learn to think critically and approach challenges in a methodical way.
In summary, Extra Challenge Graphs provide a multifaceted learning experience that builds essential skills in young children, setting a solid foundation for future academic success.


