Extra Challenge Graphs Worksheets for Ages 7-8
15 filtered results
-
From - To
Unleash the power of data interpretation and critical thinking in young learners with our Extra Challenge Graphs for Ages 7-8 worksheets. Tailored to challenge and engage young minds, these worksheets are meticulously designed to nurture analytical skills through a variety of graph types, from bar graphs to pie charts and beyond. Each activity is crafted to captivate and educate, encouraging children to delve deeper into the world of data. Perfect for both classroom and home learning environments, our Extra Challenge Graphs worksheets promise to be a delightful and educational journey into the realm of numbers and patterns for young scholars.

Swim Race Line Plot Worksheet
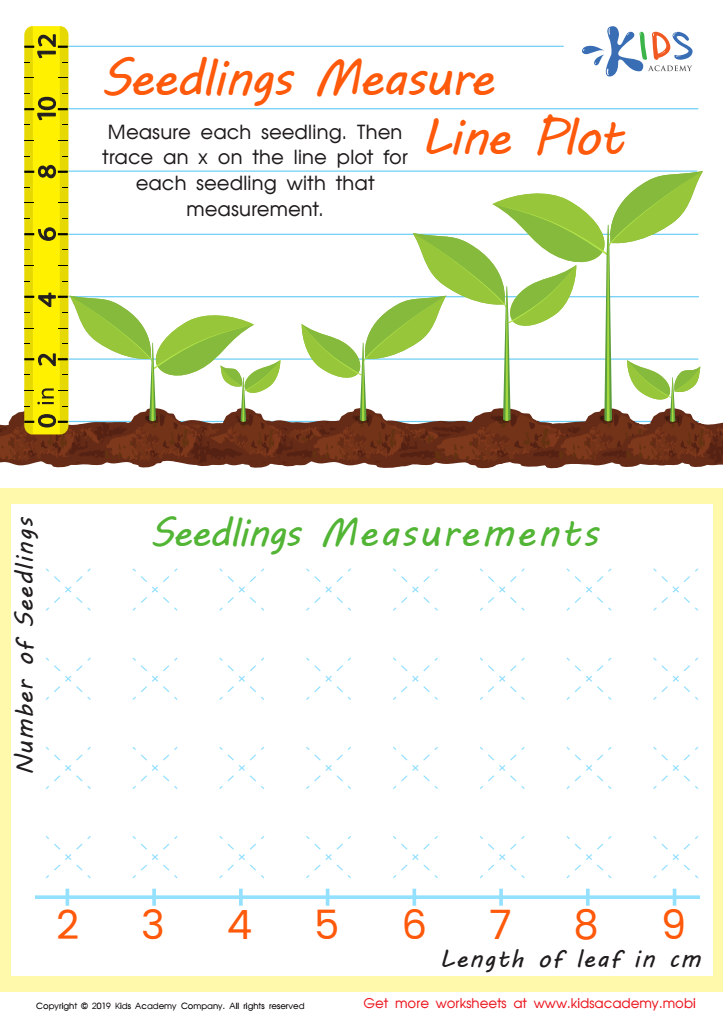
Seedling Measure Line Plot Worksheet

Leaf Measure Line Plot Worksheet
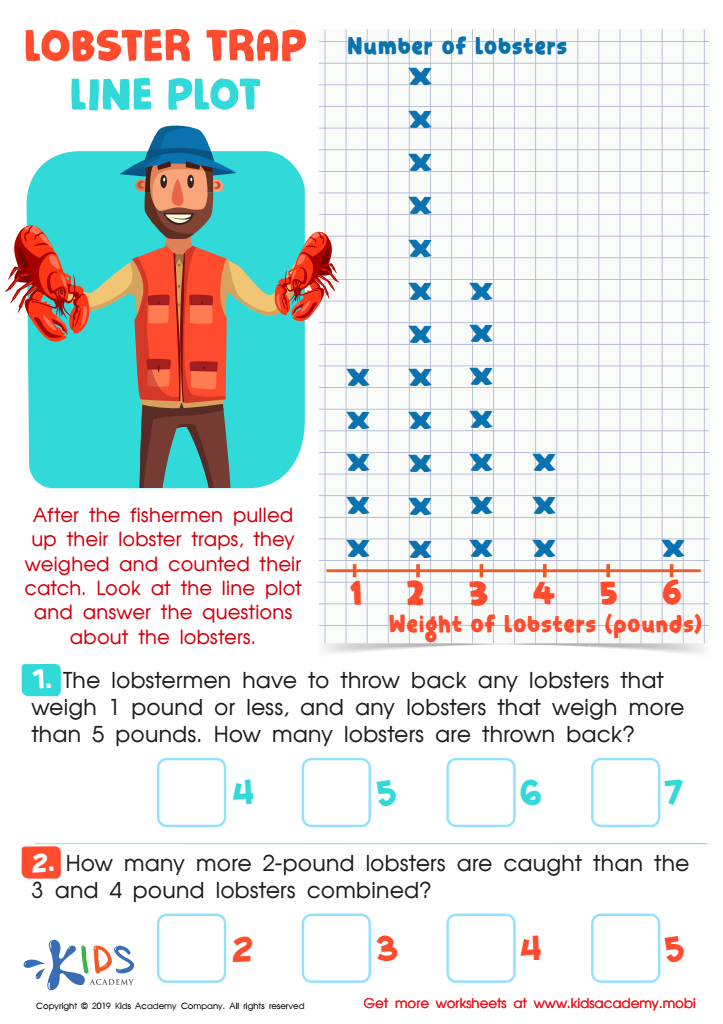
Lobster Trap Line Plot Worksheet
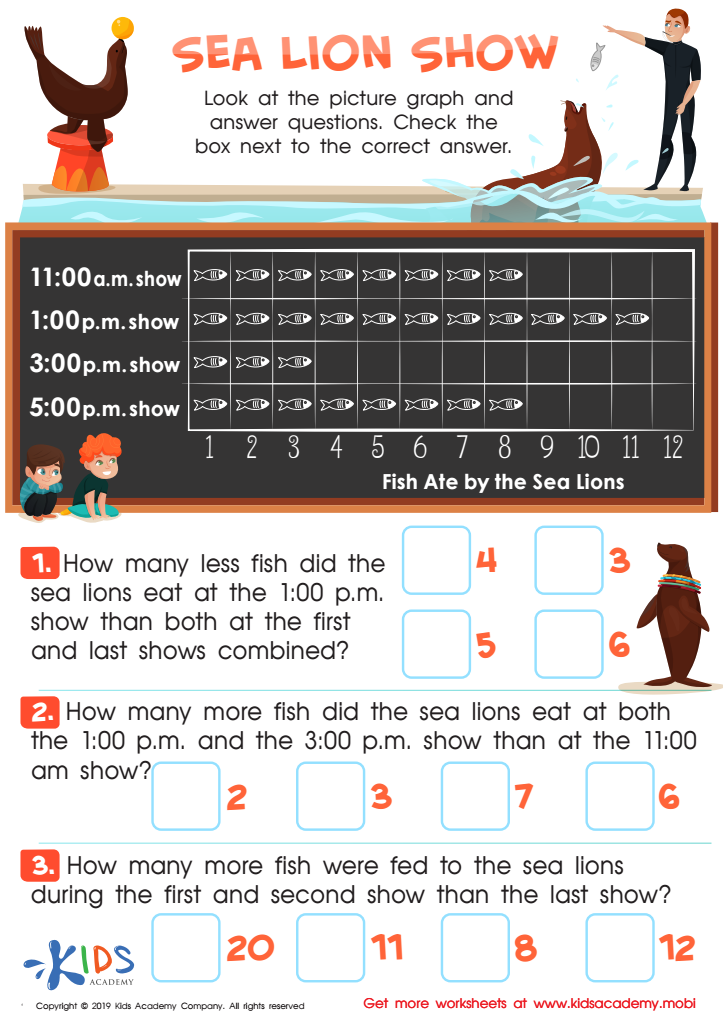
Sea Lion Show Worksheet

Planets Bar Graph Worksheet

Leaf Bar Graph Worksheet

Recycling Picture Graph Worksheet

Match Tally Marks to Bar Graphs Worksheet
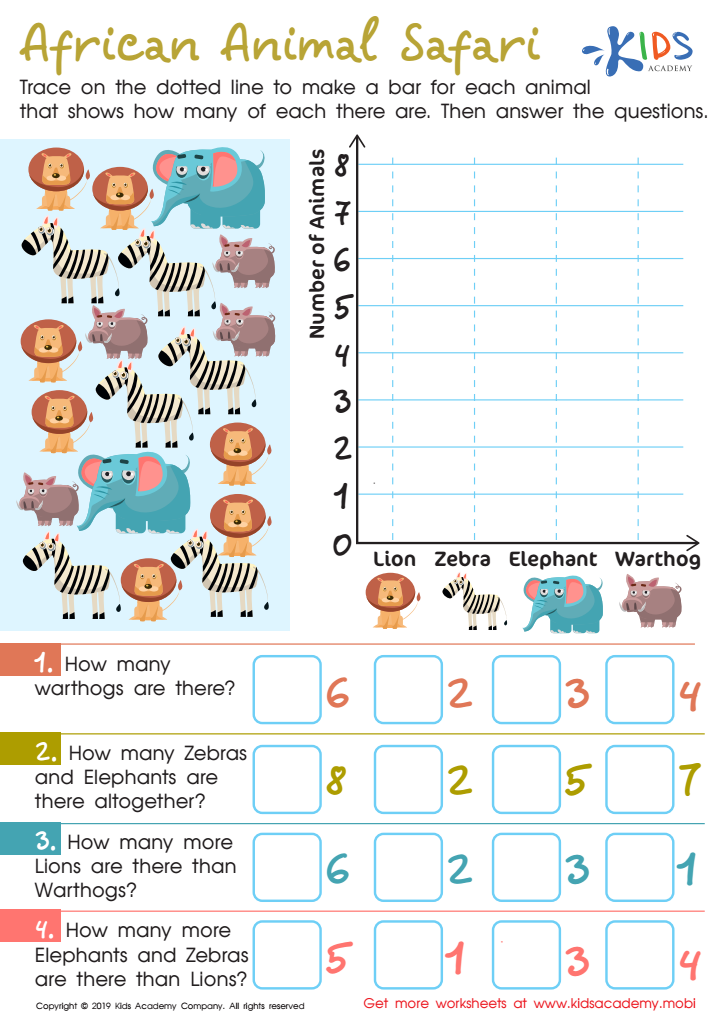
African Animal Safari Worksheet
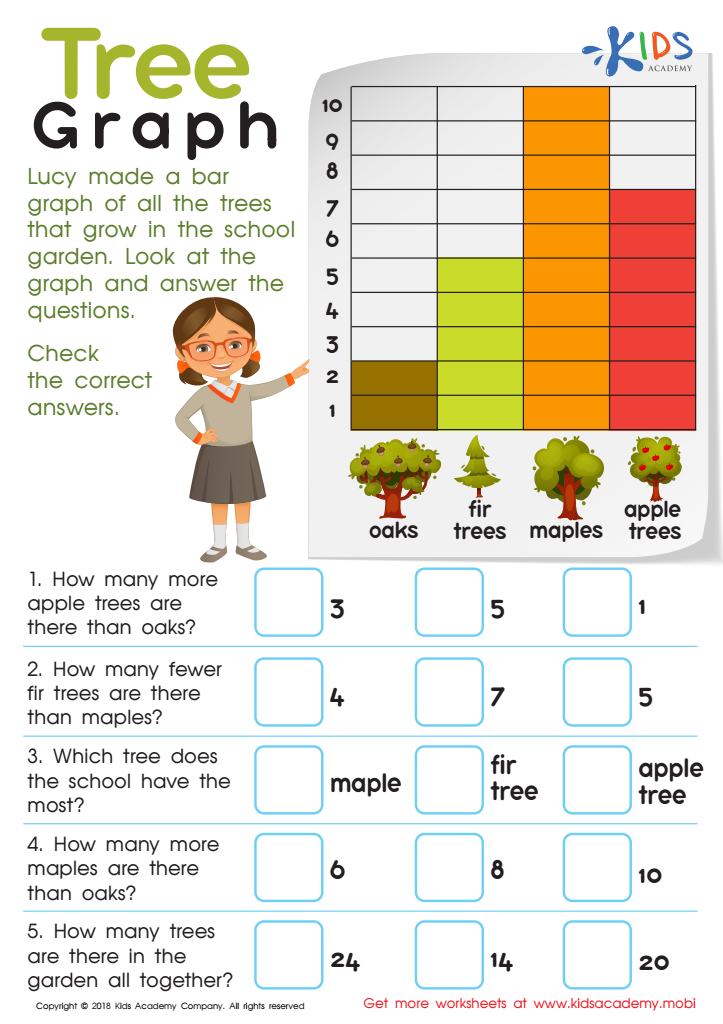
Tree Graph Worksheet
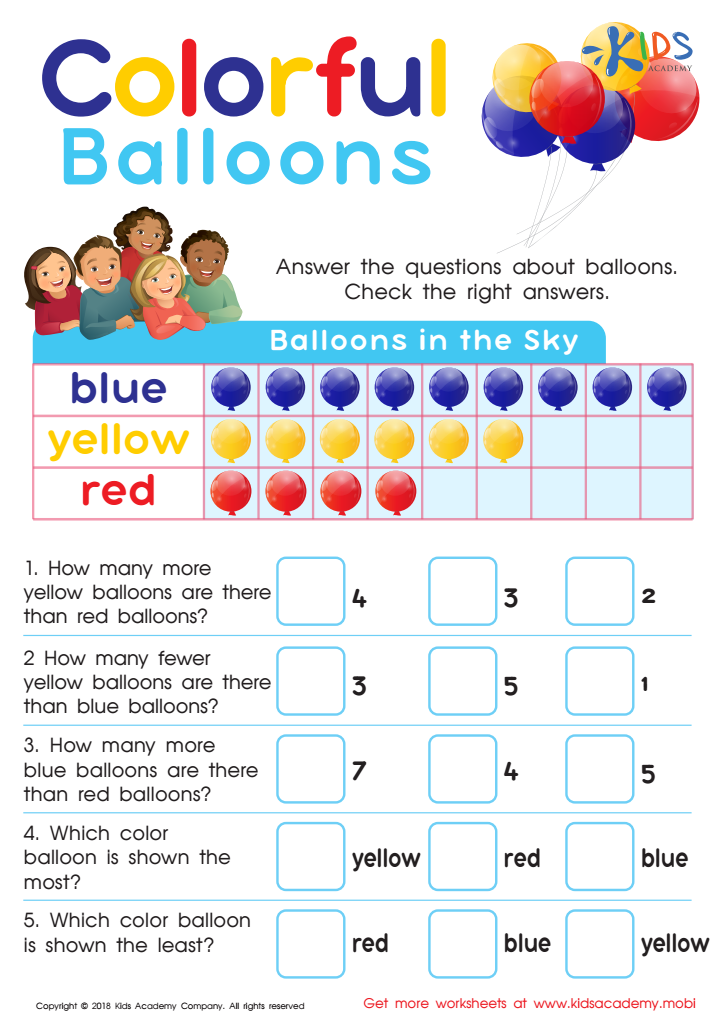
Picture Graphs: Colorful Balloons Worksheet

Interpret Line Plot Worksheet

Taxi Math Worksheet

Football Math Worksheet


Extra Challenge Graphs for Ages 7-8 are crucial learning tools that serve to sharpen young minds and enhance their understanding of basic graph concepts. At this formative stage, children are beginning to encounter and interpret various types of information. These worksheets are designed to push their boundaries slightly beyond the standard curriculum, presenting them with tasks that require a bit more thought, creativity, and problem-solving ability.
The usefulness of Extra Challenge Graphs for Ages 7-8 lies in their ability to cultivate critical thinking and data interpretation skills. By engaging with these worksheets, children learn not only to read graphs but also to analyze and draw insights from them. This early exposure to handling data prepares them for more complex mathematical and scientific concepts later in their educational journey.
Moreover, these extra challenges provide an enjoyable learning experience, which is vital for maintaining the attention and interest of children at this age. The interactive nature of graphs—whether they're bar graphs, pie charts, or line graphs—makes learning visually appealing and thus, more memorable.
In essence, Extra Challenge Graphs for Ages 7-8 serve as a bridge between basic graph reading and more advanced data analysis skills. They are an essential tool in fostering a love for mathematics and science, encouraging young learners to question, explore, and understand the world through the lens of data.


