Extra Challenge Graphs Worksheets for Ages 7-9
15 filtered results
-
From - To
Enhance your child's learning experience with our Extra Challenge Graphs Worksheets designed specifically for ages 7-9! Tailored to build critical math skills, these worksheets cultivate students' understanding of graphing concepts through engaging and challenging problems. Children will explore various types of graphs, including bar graphs, line graphs, and pictographs, while improving their analytical thinking and data interpretation abilities. Perfect for classroom reinforcement or homeschooling, these printable worksheets are an excellent way to encourage independent learning and boost confidence in math. Give your young learners the extra challenge they need to excel in graphing tasks today!

Swim Race Line Plot Worksheet
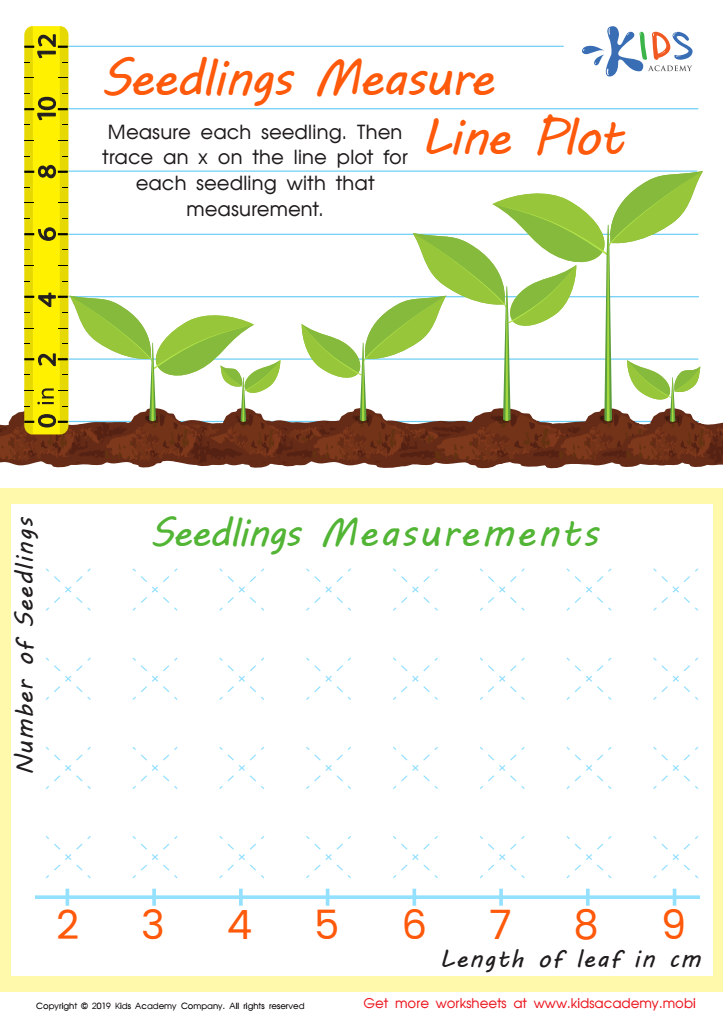
Seedling Measure Line Plot Worksheet

Leaf Measure Line Plot Worksheet
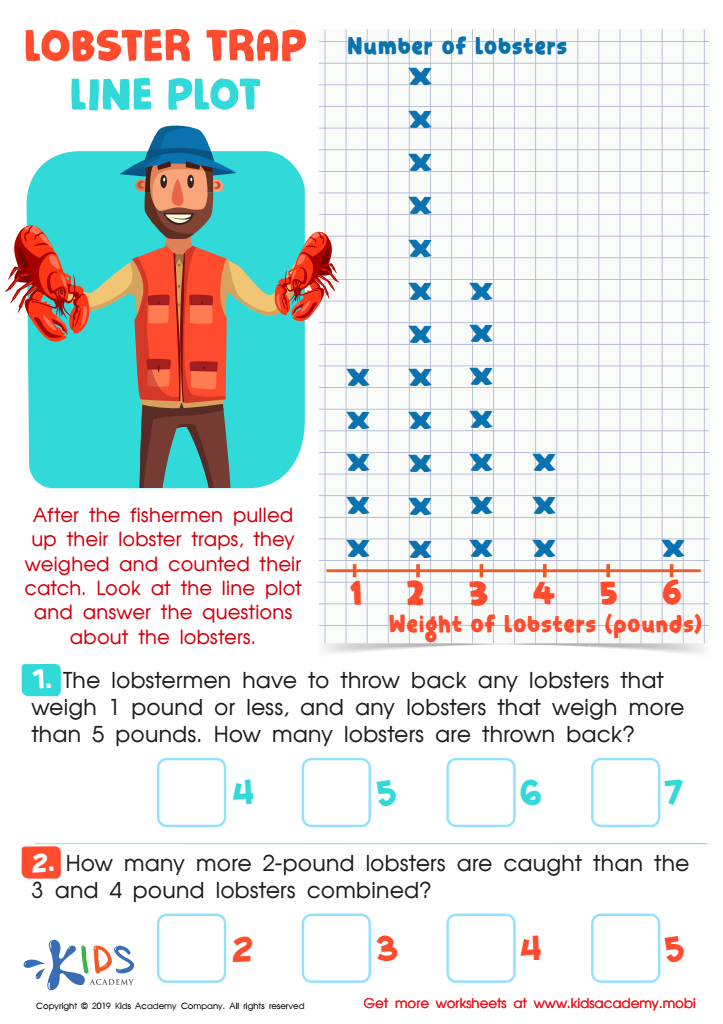
Lobster Trap Line Plot Worksheet
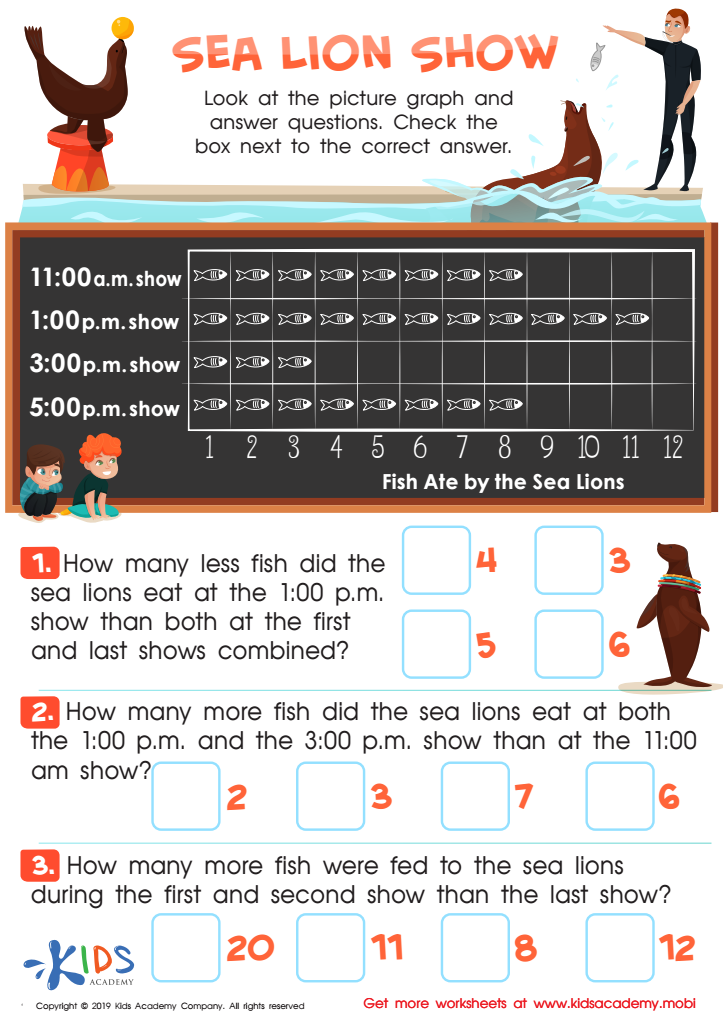
Sea Lion Show Worksheet

Planets Bar Graph Worksheet

Leaf Bar Graph Worksheet

Recycling Picture Graph Worksheet

Match Tally Marks to Bar Graphs Worksheet
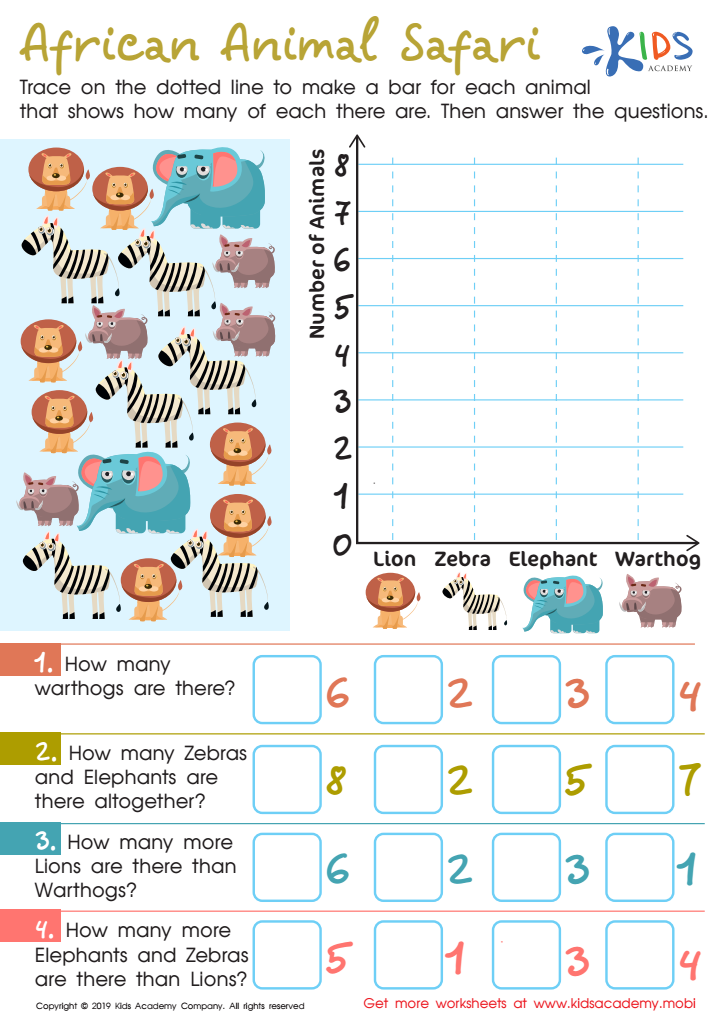
African Animal Safari Worksheet
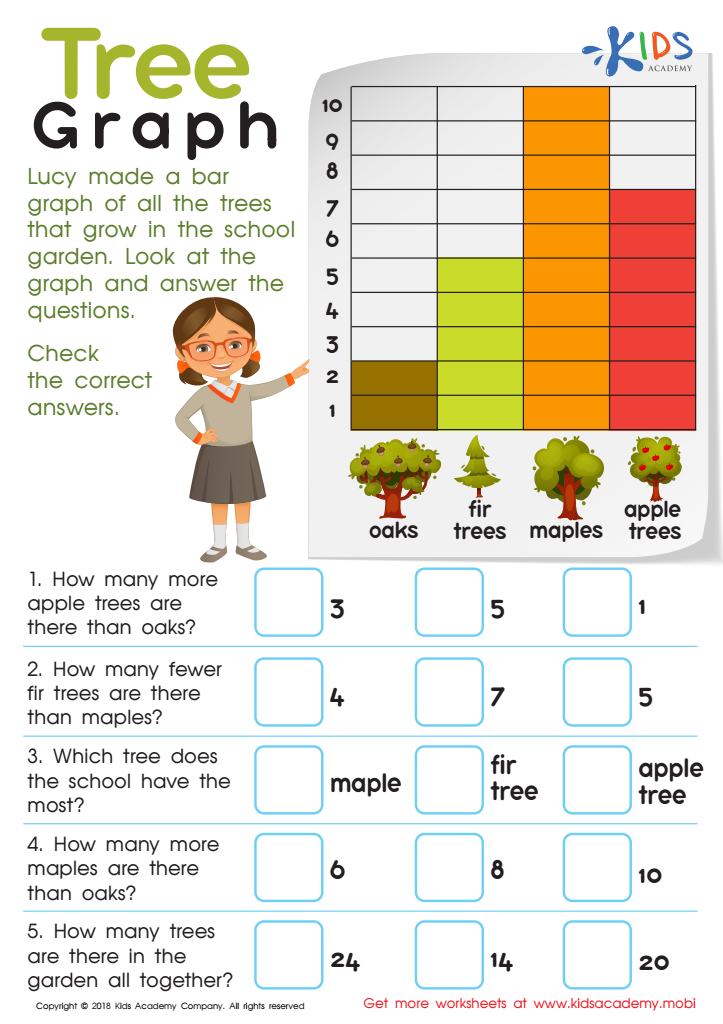
Tree Graph Worksheet
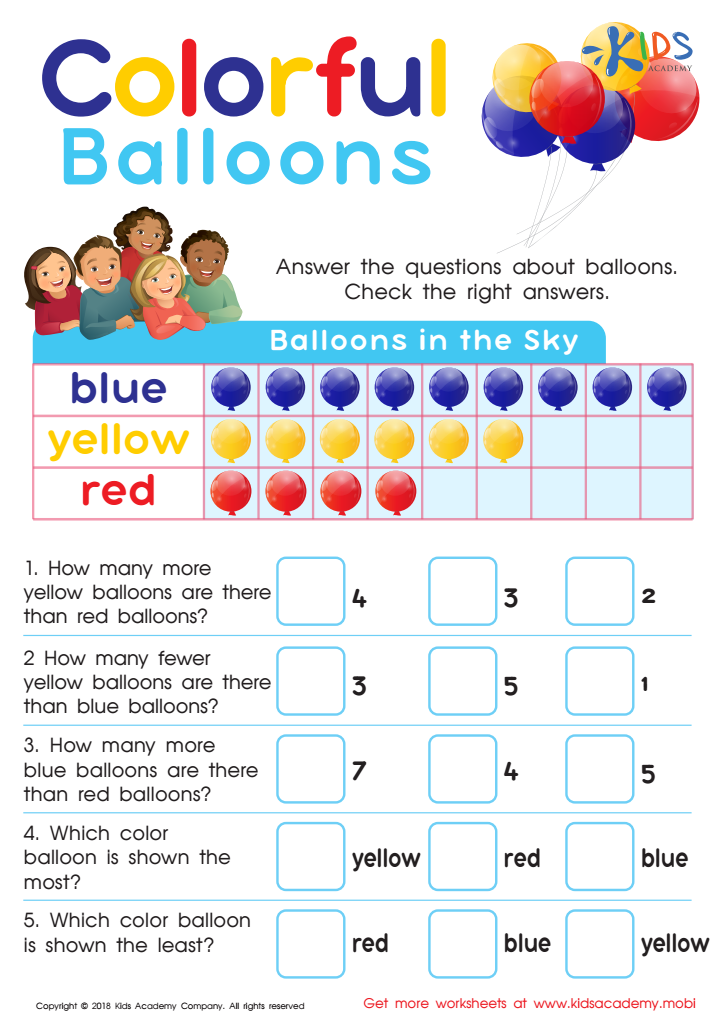
Picture Graphs: Colorful Balloons Worksheet

Interpret Line Plot Worksheet

Taxi Math Worksheet

Football Math Worksheet


Extra Challenge Graphs for ages 7-9 are an important educational tool for parents and teachers as they support the development of critical thinking and analytical skills in young learners. At this stage, children are beginning to grasp fundamental concepts in math and science, and introducing them to the world of data representation fosters not only numerical literacy but also enhances their ability to make sense of information.
By engaging with Extra Challenge Graphs, children learn how to interpret data, recognize trends, and understand relationships between different variables. This early exposure to graphing can strengthen their problem-solving skills and encourages them to ask questions, making their learning experience more interactive and enriching.
Moreover, these graphs can serve as a springboard for conversations at home or in the classroom about real-world applications, such as how data is used in various fields. For instance, understanding graphs can lead to discussions about sports statistics, weather patterns, or even surveys.
Ultimately, integrating Extra Challenge Graphs into a child’s education not only supports their math skills but also prepares them for future academic challenges and fosters a lifelong appreciation for data analysis and critical thinking. Parents and teachers should embrace and prioritize this tool to create a more well-rounded learning experience.


