Normal Graphs Worksheets for Ages 7-9
4 filtered results
-
From - To
Explore our engaging Normal Graphs Worksheets designed for children ages 7 to 9! These worksheets make learning about graphs fun and interactive, helping young learners develop critical math skills. Each worksheet offers a variety of colorful and stimulating exercises that introduce concepts like bar graphs, line graphs, and pictographs. Ideal for both classroom use and at-home practice, our resources encourage kids to analyze data, draw conclusions, and improve their problem-solving abilities. Get your child started on the path to math mastery with these easy-to-follow, printable worksheets that cater to their age group and learning level. Visit us today!
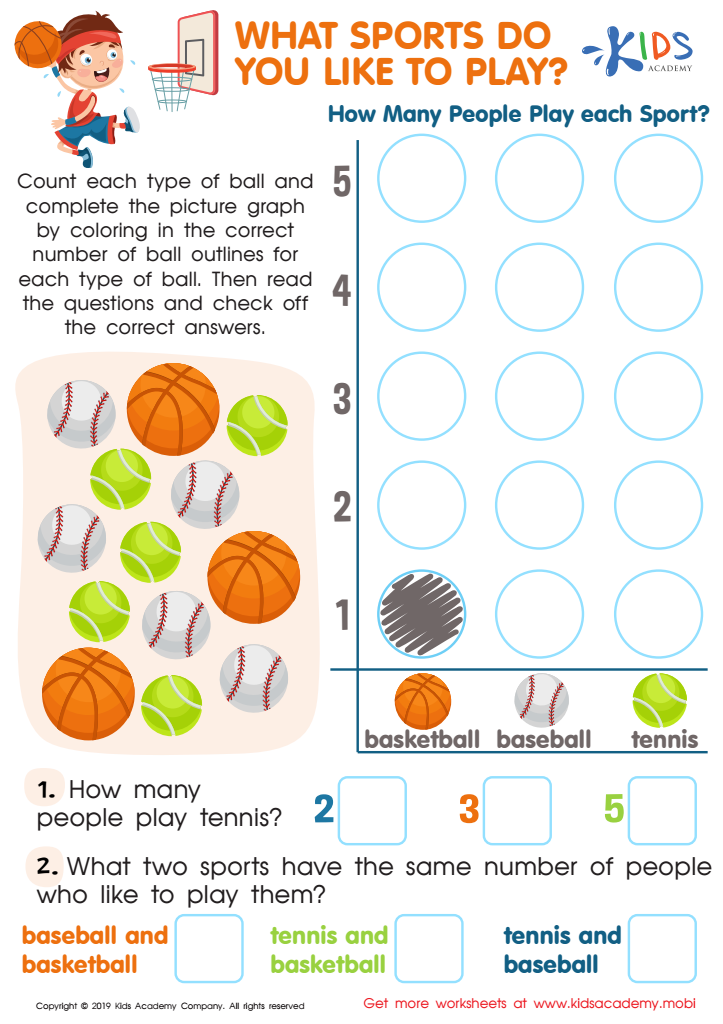
What Sports Do You Like to Play Worksheet
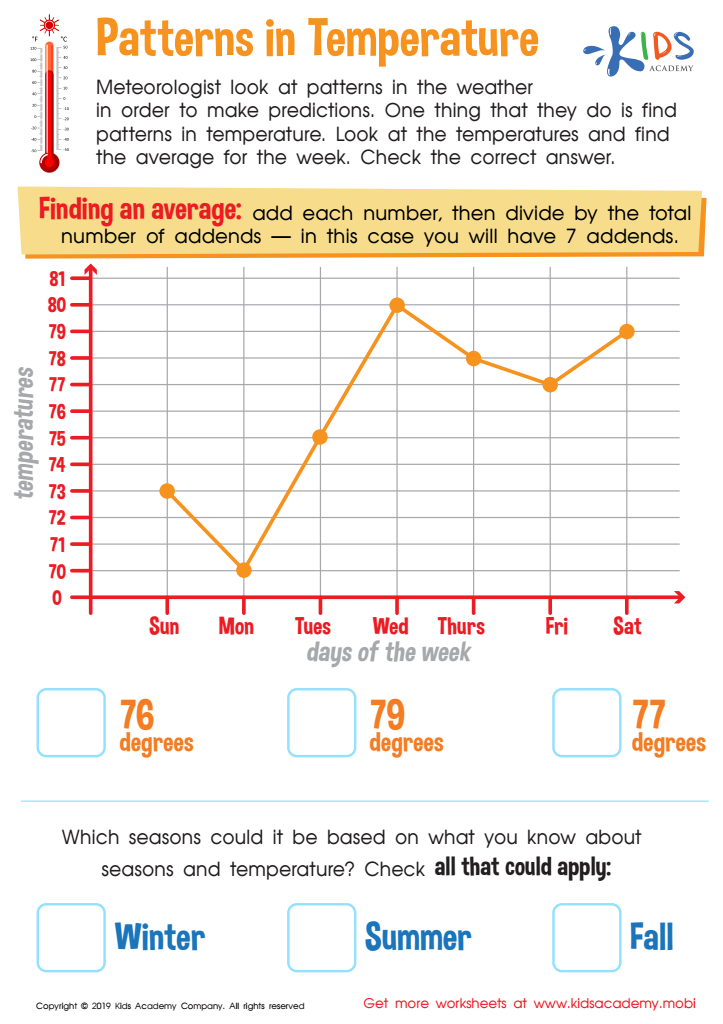
Patterns in Temperature Worksheet
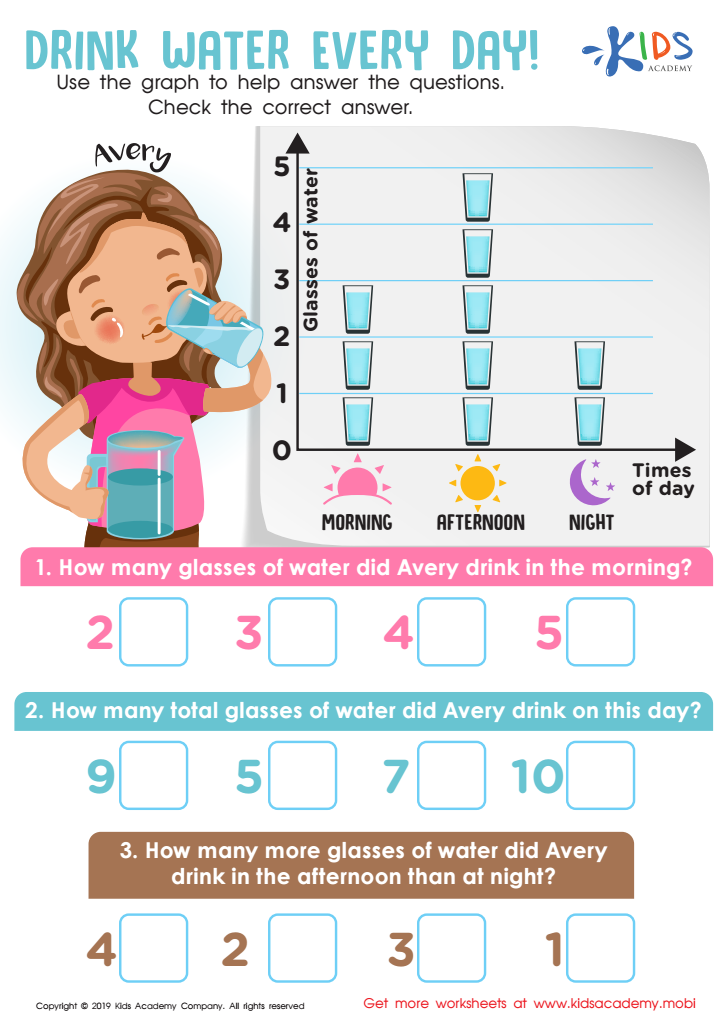
Drink Water Every Day! Worksheet

Graph: Baby Animals Worksheet


Normal graphs, or learning graphs, are valuable tools for parents and teachers working with children aged 7-9. During this developmental stage, students are honing their critical thinking and problem-solving skills, and normal graphs can play a crucial role in that process.
These graphs provide a visual representation of relationships between variables, making complex data more accessible for young learners. By exposing students to graphical data early on, educators can foster an understanding of the importance of data interpretation in real-world scenarios. This lays the foundation for skills in mathematics, science, and even everyday decision-making.
Additionally, using normal graphs encourages collaborative learning, as children discuss what they see and how to analyze the information presented. It strengthens communication skills and boosts engagement, as students can express their thoughts visually. Parents should engage with their children by exploring graphs in homework or during everyday situations, such as analyzing sports statistics or expenses, reinforcing these concepts at home and making learning more interactive.
Overall, incorporating normal graphs into learning supports cognitive growth, promotes curiosity, and equips children with essential skills for their academic journey, ensuring a well-rounded educational experience.