Graphs Worksheets for Ages 7-9 - Page 2
27 filtered results
-
From - To
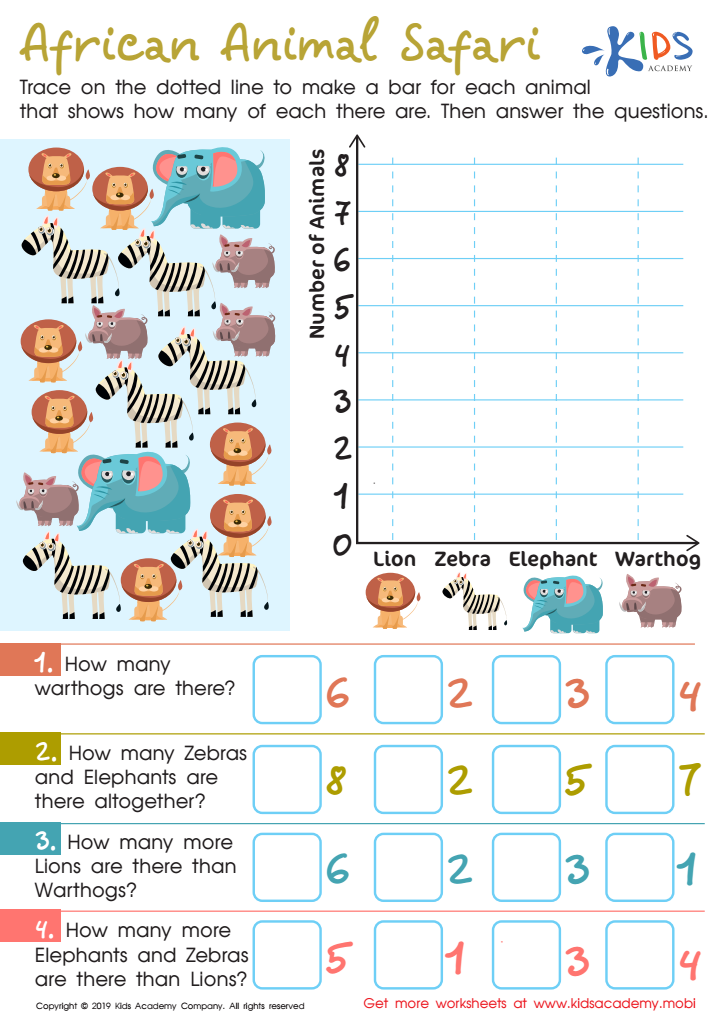
African Animal Safari Worksheet

Leaf Measure Line Plot Worksheet

Football Math Worksheet


Graphs are a crucial educational tool for children aged 7 to 9, as they enhance understanding and analysis of information. At this age, children are developing critical thinking skills, and graphs provide a visual means to interpret data, making complex information more accessible.
Firstly, graphs help students grasp the concepts of comparison, patterns, and trends. By visually representing data, children learn to compare quantities, recognize relationships, and identify changes over time. This foundational understanding supports future subjects such as math, science, and social studies, where data interpretation is vital.
Moreover, engaging with graphs fosters analytical skills. Children are encouraged to view information critically, asking questions and drawing conclusions based on what they observe. This not only aids academic progress but also cultivates a mindset essential for lifelong learning.
Additionally, teaching children about graphs aligns with developing digital literacy. As they increasingly encounter digital media, understanding how to interpret data visually prepares them for a data-driven world.
Ultimately, by prioritizing graphs as a part of their curriculum, parents and teachers empower young learners with essential skills that will benefit them in school and beyond, laying a strong foundation for future academic endeavors.


