Interpreting data Worksheets for 8-Year-Olds
7 filtered results
-
From - To
Welcome to our "Interpreting Data Worksheets for 8-Year-Olds" page! Here, you'll find a variety of engaging and age-appropriate worksheets designed to help young learners understand and interpret data effectively. Our resources provide hands-on practice with basic graphs, charts, and tables, making data interpretation fun and accessible. Each worksheet promotes critical thinking and analytical skills while aligning with educational standards. Perfect for classroom use or at-home practice, these worksheets offer children a chance to enhance their math skills and boost their confidence in reading and understanding data. Explore our collection and support your child's learning journey today!
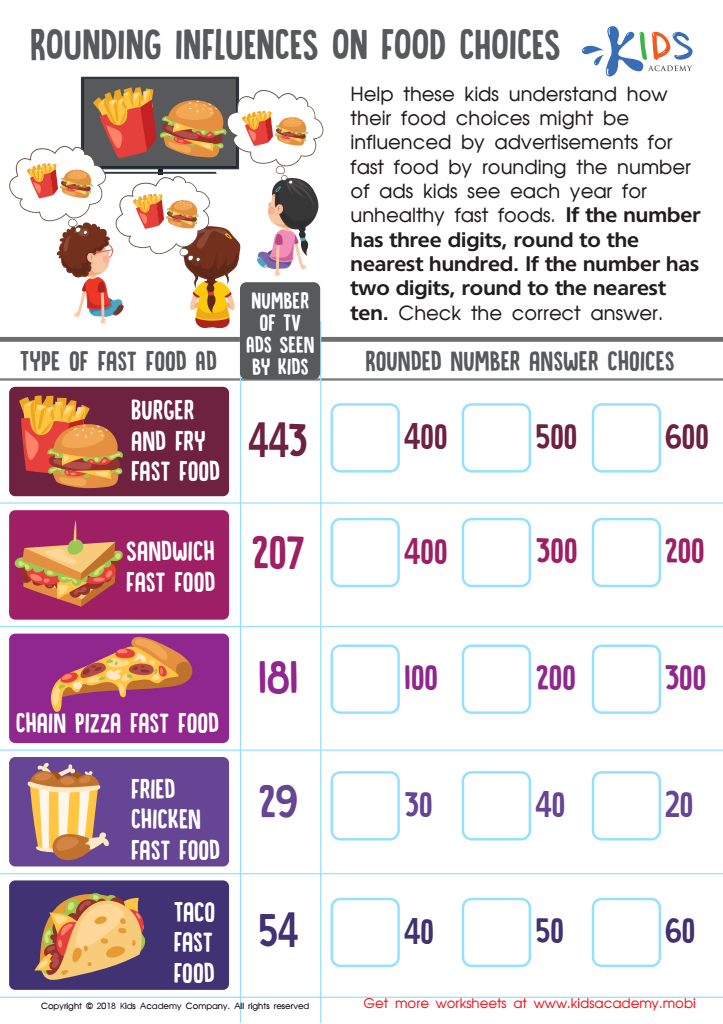
Rounding Influences Food Choices Worksheet

Interpret Line Plot Worksheet

Leaf Bar Graph Worksheet
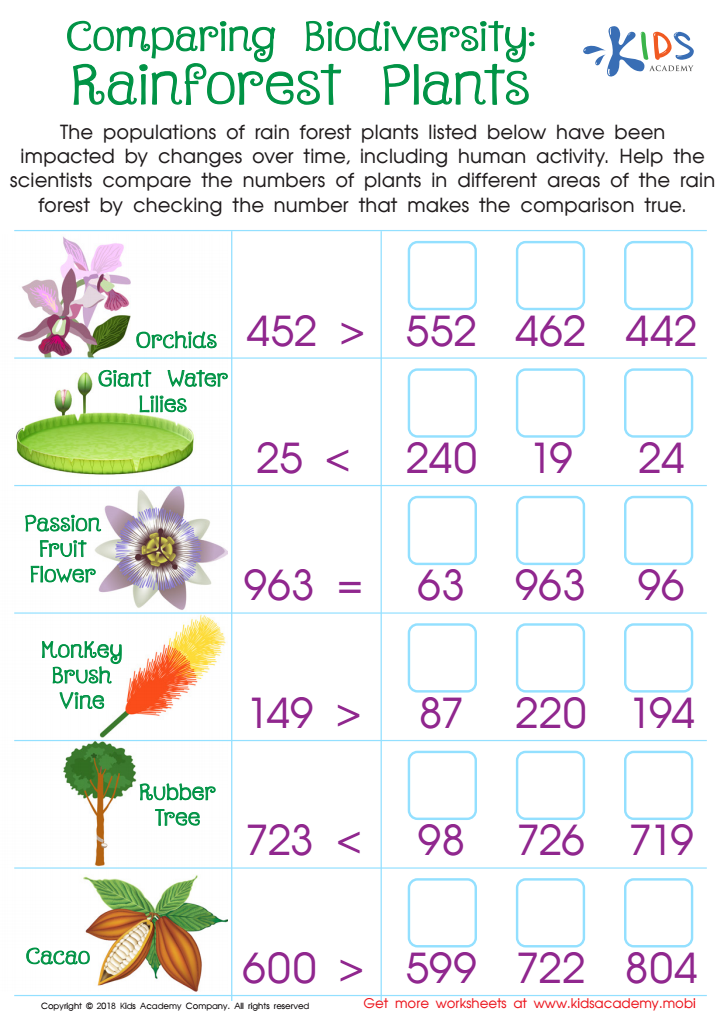
Comparing Biodiversity: Rainforest Plants Worksheet
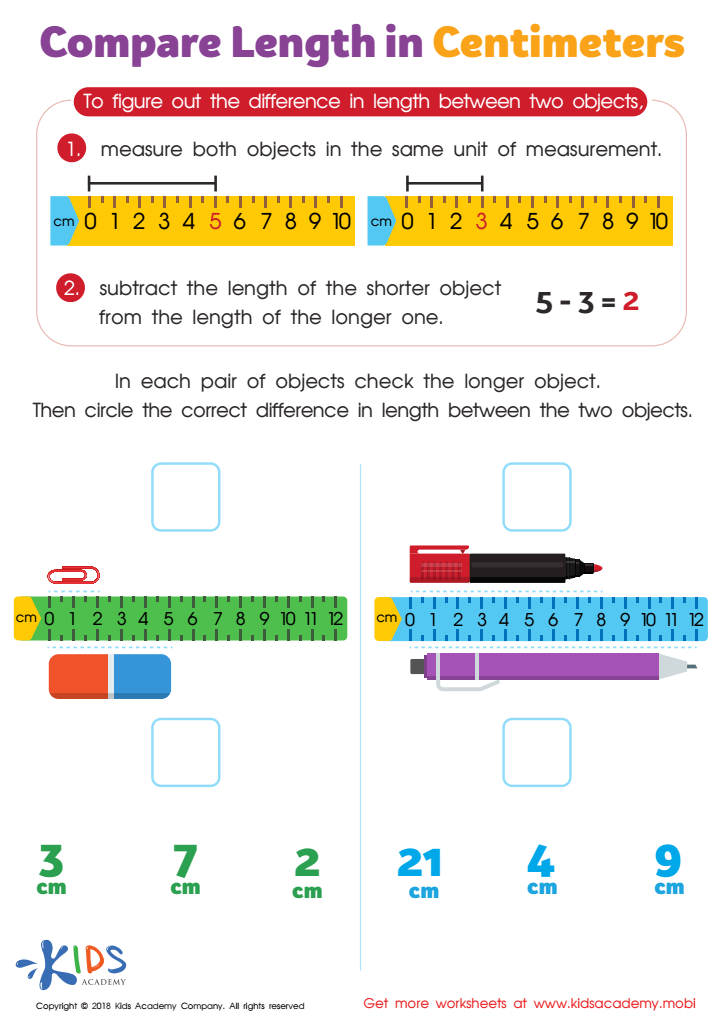
Compare Length in Centimeters Worksheet

Pencil Case Line Plot Worksheet

Family Line Plot Worksheet


.jpg)

Interpreting data is an essential skill for 8-year-olds as it fosters critical thinking, enhances problem-solving abilities, and nurtures a sense of inquiry. For parents and teachers, helping children understand data concepts can significantly enrich their learning experiences and prepare them for future challenges. At this age, children are beginning to explore the world more deeply; introducing data interpretation enables them to make sense of information they encounter—whether in stories, experiments, or everyday life.
Incorporating data analysis into lessons promotes skills such as categorization, comparison, and drawing conclusions. It encourages children to ask questions, develop hypotheses, and test their ideas. When students learn to interpret results from surveys or simple experiments, they cultivate analytical skills and gain confidence in their ability to understand complex ideas.
Additionally, teaching data interpretation fosters digital literacy in an increasingly data-driven world, ensuring that children grow up capable of navigating and critiquing information. Supporting this skill means preparing children not just for academic success, but for active, informed participation in society. Ultimately, parents and teachers play a crucial role in shaping young learners' perspectives on data, empowering them to become thoughtful, discerning individuals in the future.


