Graphs Worksheets for Ages 3-9 - Page 2
27 filtered results
-
From - To
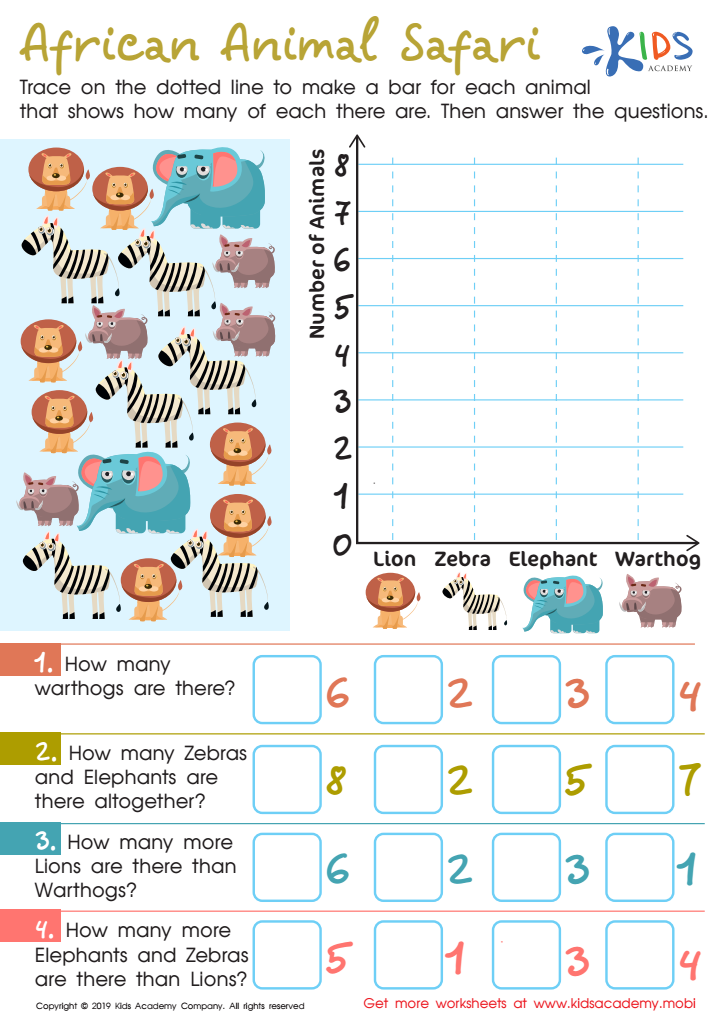
African Animal Safari Worksheet

Leaf Measure Line Plot Worksheet

Football Math Worksheet


Parents and teachers should care about introducing graphs to children ages 3-9 because early exposure to this fundamental concept can greatly enhance their cognitive development and foundational learning skills. At this age, children are naturally curious and capable of understanding basic graphical representations, which serve as visual tools to organize and interpret information.
Graphs can make abstract concepts more concrete and understandable. For example, simple picture graphs or bar charts can help young children visualize counting, comparing quantities, and recognizing patterns. This can improve their number sense and critical thinking skills. Watching a bar graph grow as data points are added can also make learning exciting and engaging, as children can see real-time results of their input.
Furthermore, learning about graphs encourages the development of valuable skills such as categorization, sequencing, and data interpretation, which are essential for everyday problem-solving. By understanding how to create and read graphs, kids also gain early experience in scientific thinking and methodological approaches.
Lastly, early comfort and familiarity with graphical information lay a strong foundation for more complex mathematical and analytical skills required in later education stages. Fostered enthusiasm for graphs at a young age consequently promotes lifelong learning and analytic competence, preparing children for future academic and real-world challenges.


