Data interpretation Easy Worksheets for Ages 3-9
11 filtered results
-
From - To
Explore our engaging "Data Interpretation Easy Worksheets" designed specifically for children ages 3-9! These worksheets provide a fun and interactive way for young learners to develop essential skills in analyzing and interpreting data. With colorful visuals and simple formats, children will enjoy answering questions related to graphs, charts, and basic statistics. Perfect for both classroom and home use, these worksheets promote critical thinking and help kids become confident in their ability to understand and make sense of information. Facility in data interpretation is foundational for future learning, and these resources set the stage for a lifelong love of math and analysis!

Fruit Math: Picture Graphs Worksheet

Students Line Plot Worksheet
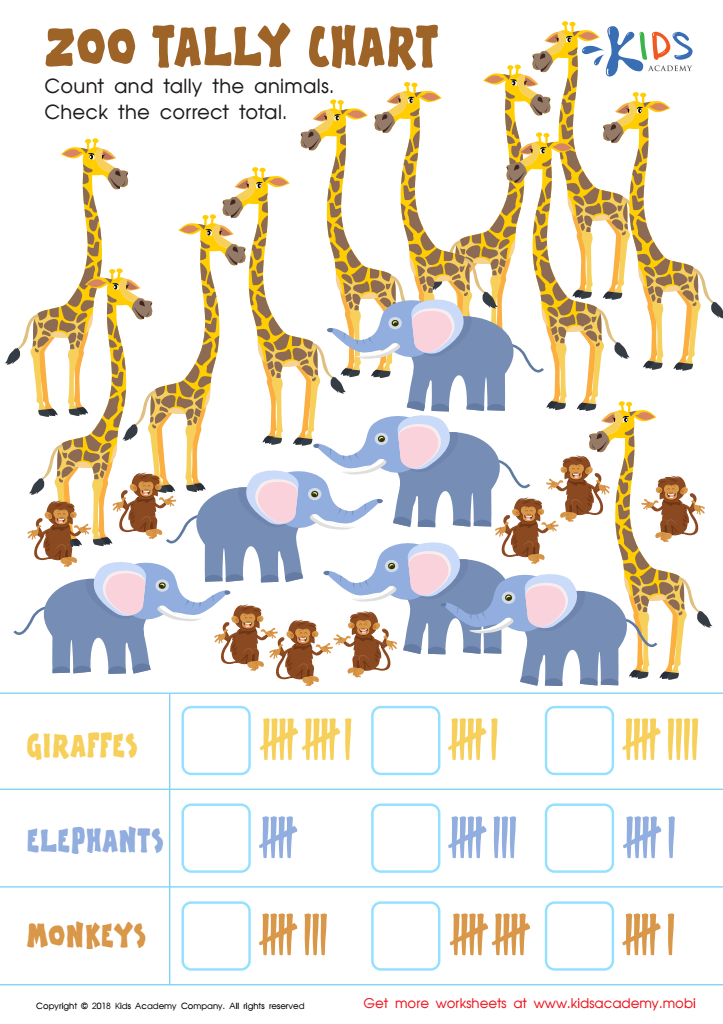
Zoo Tally Chart Worksheet
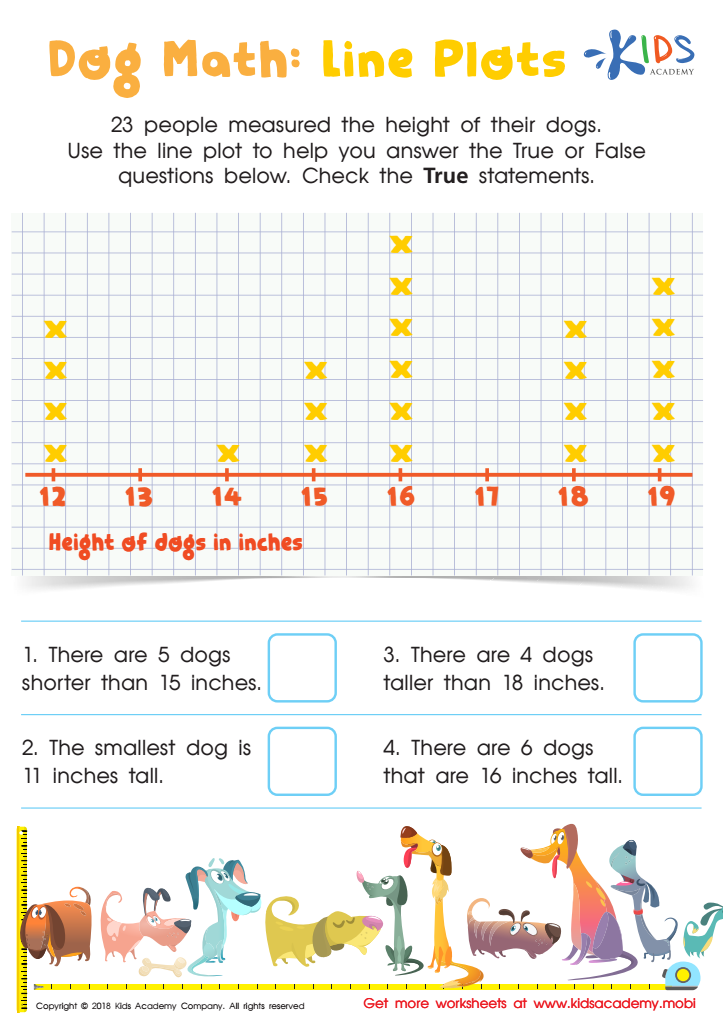
Dog Math: Line Plots Worksheet
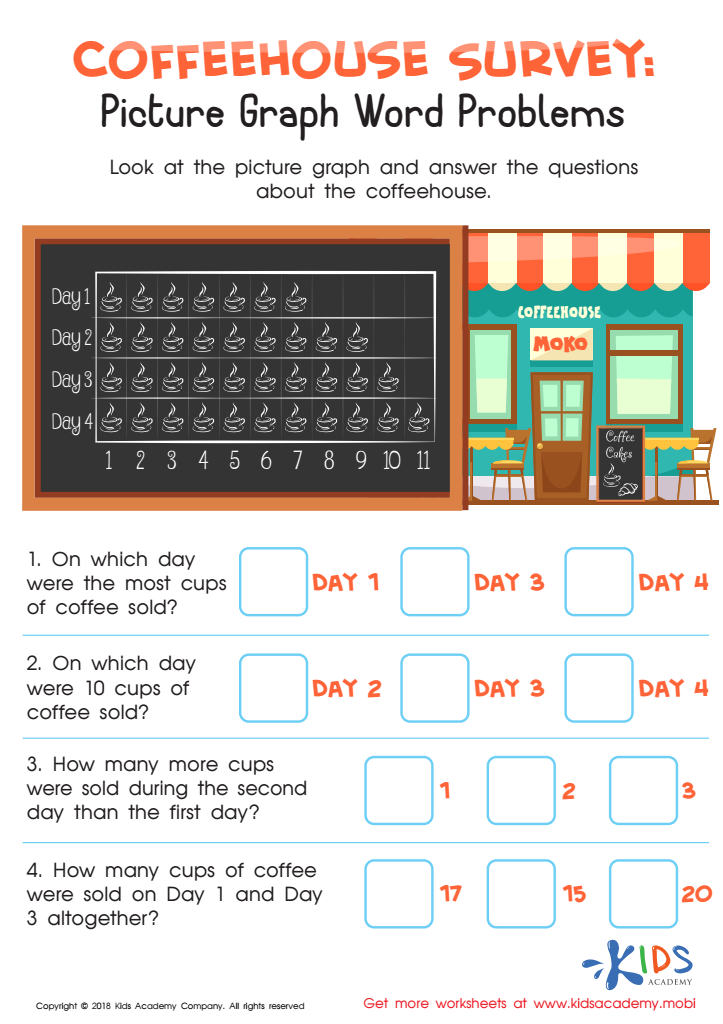
Coffeehouse Survey: Picture Graph Word Problems Worksheet
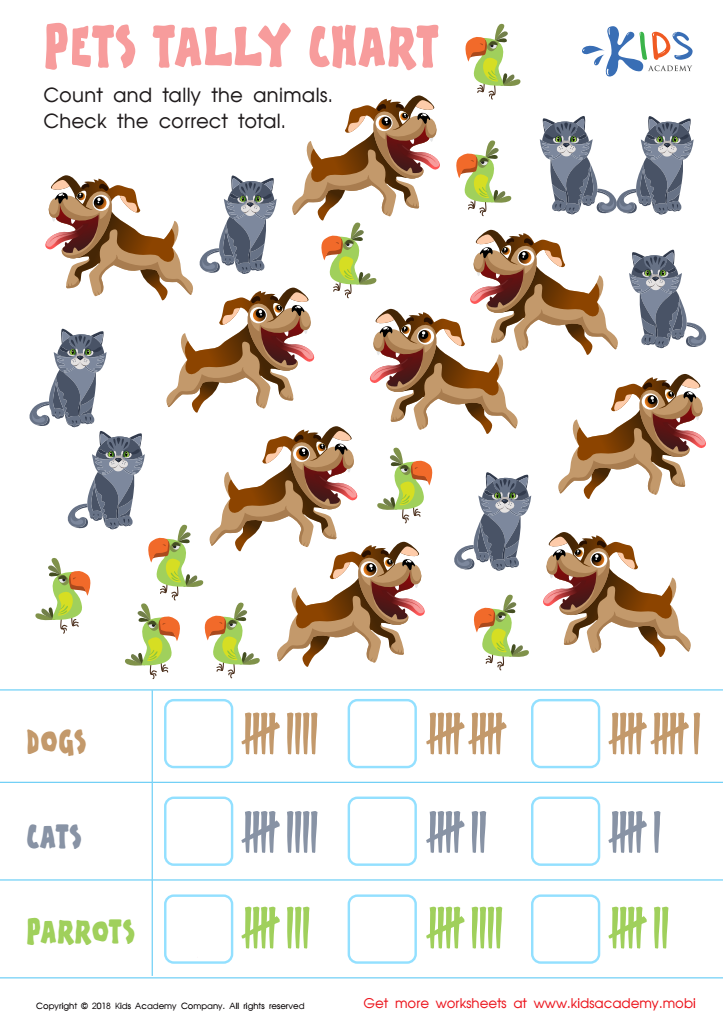
Pets Tally Chart Worksheet
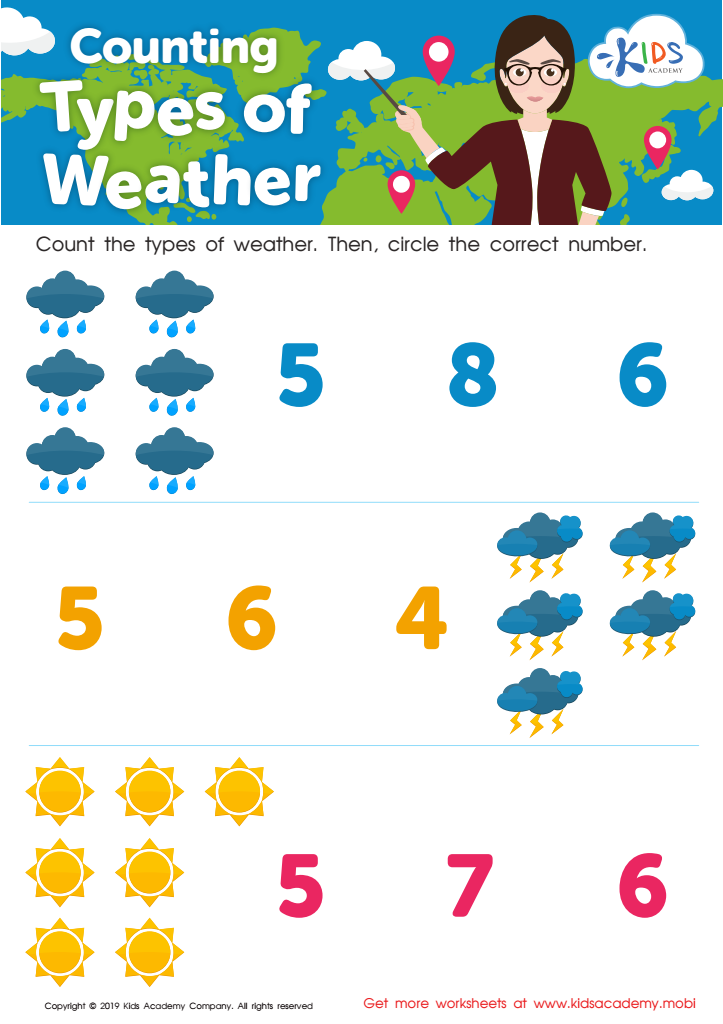
Counting Types of Weather Worksheet

Aircraft Carrier Picture Graphs Worksheet
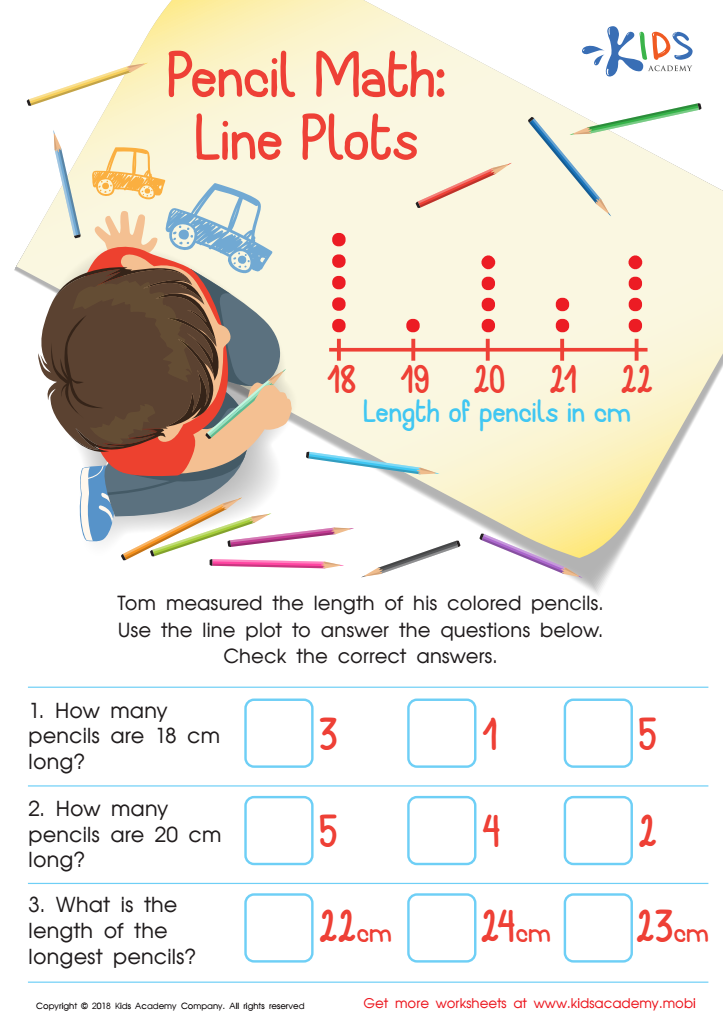
Pencil Math: Line Plots Worksheet
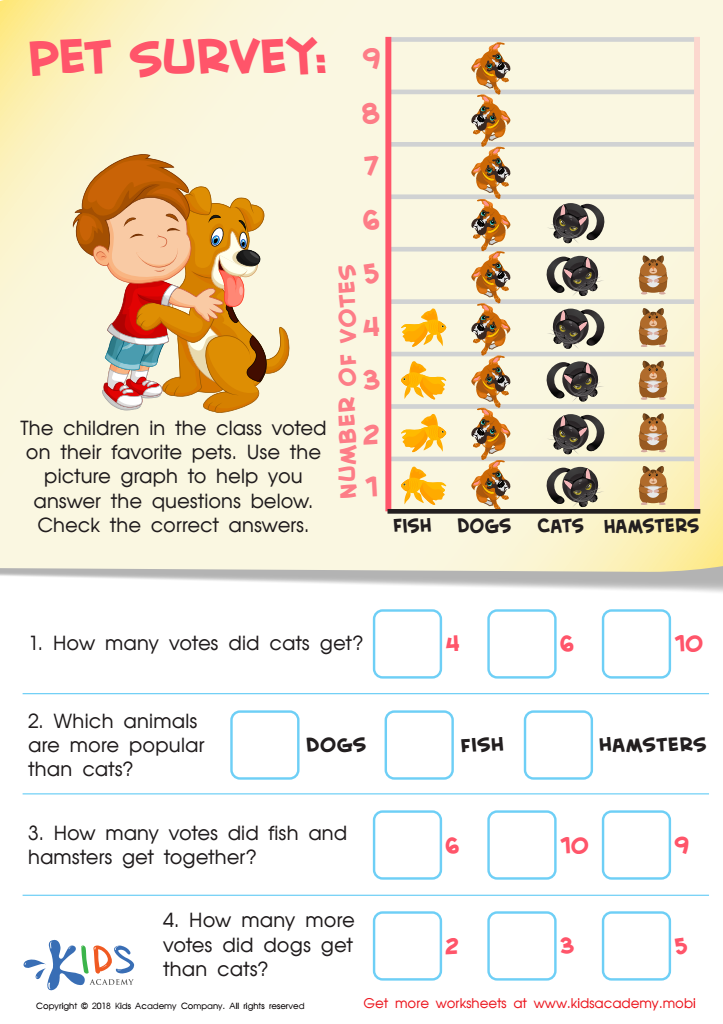
Pet Survey Worksheet
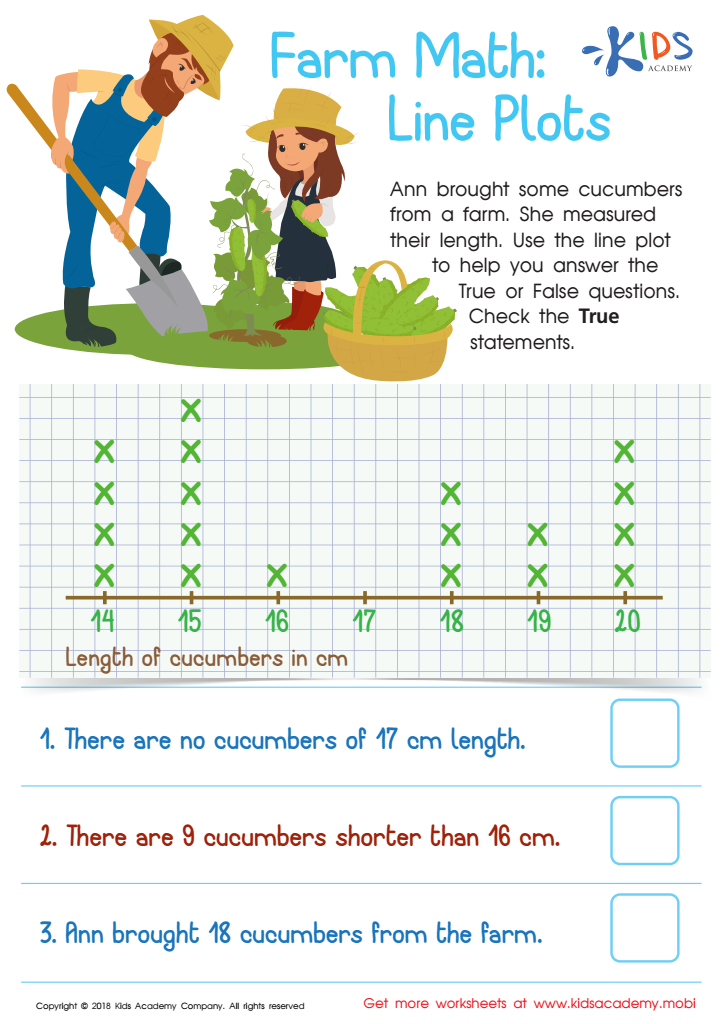
Farm Math: Line Plots Worksheet


%20(1).jpg)

Data interpretation is an essential skill for young children that helps them learn how to understand and analyze information in the world around them. For parents and teachers, fostering this skill at ages 3-9 is crucial as it lays the groundwork for critical thinking, problem-solving, and informed decision-making.
By introducing young learners to data in simple, relatable contexts—like their favorite fruits or toys—parents and teachers can make data interpretation fun and engaging. It helps children develop the ability to recognize patterns, compare quantities, and draw conclusions from visual representations like charts and graphs. These early experiences with data shape their understanding of the world, making them more curious and better equipped to ask questions.
Moreover, learning to interpret data also enhances communication skills. When children discuss what they observe, they practice articulating their thoughts clearly. This is invaluable as they grow older and face more complex ideas. Caregivers and educators play a vital role in creating a supportive environment where children feel comfortable experimenting with and interpreting data, ultimately preparing them for future academic challenges and fostering a lifelong love of learning.