Understanding charts Worksheets for Kids
1 filtered results
-
From - To
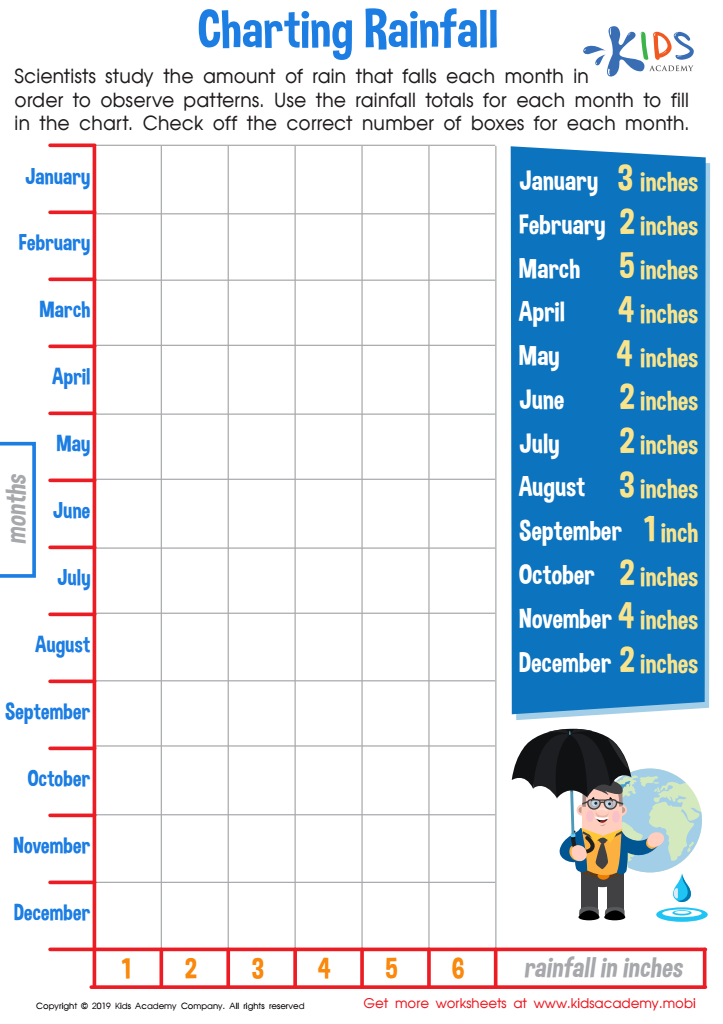
Charting Rainfall Worksheet
Question/Answer
What does the Understanding charts skill mean when it comes to Grade 3 Our Planet and Environment learning?
The "Understanding charts" skill in the context of Grade 3 learning about Our Planet and Environment involves teaching students how to read and interpret various types of charts, such as bar graphs, pie charts, and line graphs. This skill helps them visualize and understand data related to environmental topics, like weather patterns, animal populations, or recycling statistics.
How to train the Understanding charts skill in Grade 3 students learning about Our Planet and Environment?
To train Grade 3 students in the Understanding charts skill in context to Our Planet and Environment, use interactive and visual learning methods. Introduce simple charts related to weather patterns, recycling statistics, or animal habitats. Guide students through reading these charts, identifying key information, and discussing their findings.
What are some effective activities to train students’ Understanding charts skill when teaching them about Our Planet and Environment?
Effective activities include creating interactive climate graphs, analyzing environmental data trends, participating in virtual simulations of ecosystem changes, comparing historical and current global temperature charts, plotting pollution levels over time, and interpreting renewable energy usage statistics. These activities can enhance students' skills in understanding and drawing insights from various environmental charts and graphs.