Interpreting data Normal Worksheets for Ages 3-9
4 filtered results
-
From - To
Discover our engaging "Interpreting Data Normal Worksheets" designed specifically for children ages 3-9. These worksheets provide a fun and interactive way for young learners to develop their data interpretation skills. Tailored to enhance critical thinking, students will explore topics such as visual data representation, comparisons, and basic analysis through colorful charts and relatable examples. Promoting essential math skills early on, these worksheets are a fantastic resource for teachers and parents eager to support their child's learning journey. Dive into the world of data interpretation and foster a strong foundation for future academic success with Kids Academy’s thoughtfully created worksheets!
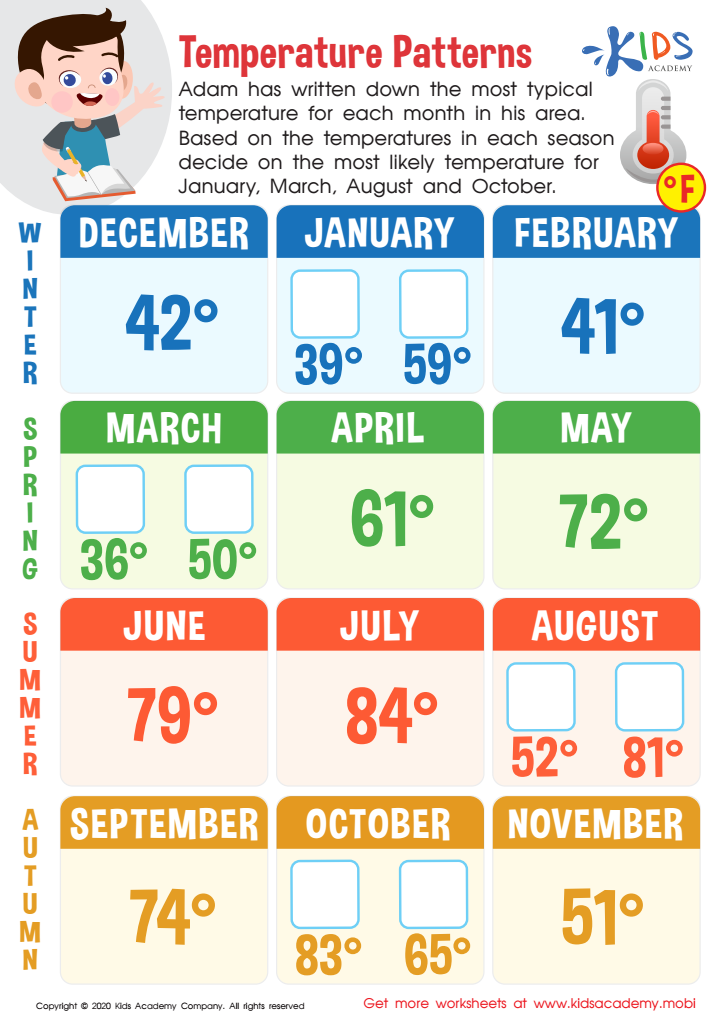
Temperature Patterns Worksheet
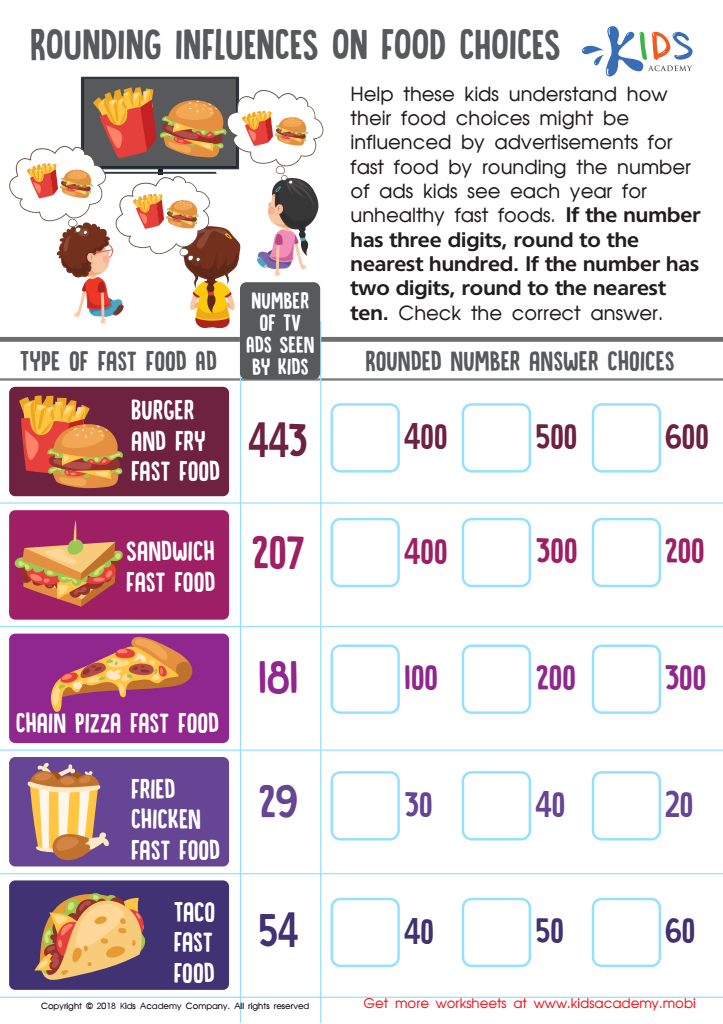
Rounding Influences Food Choices Worksheet
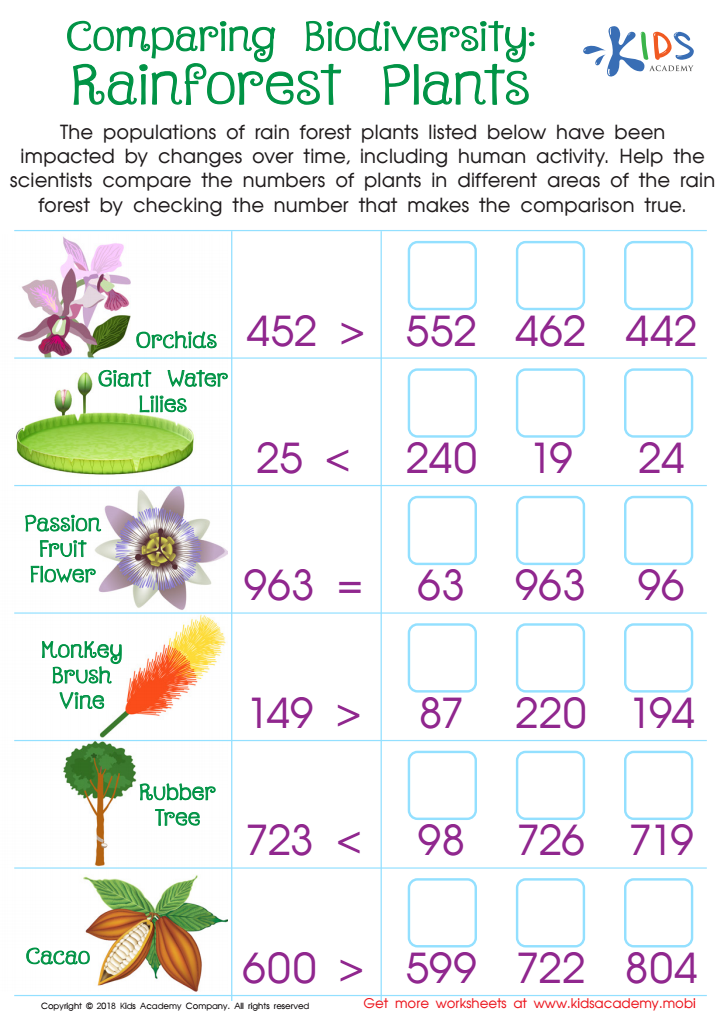
Comparing Biodiversity: Rainforest Plants Worksheet
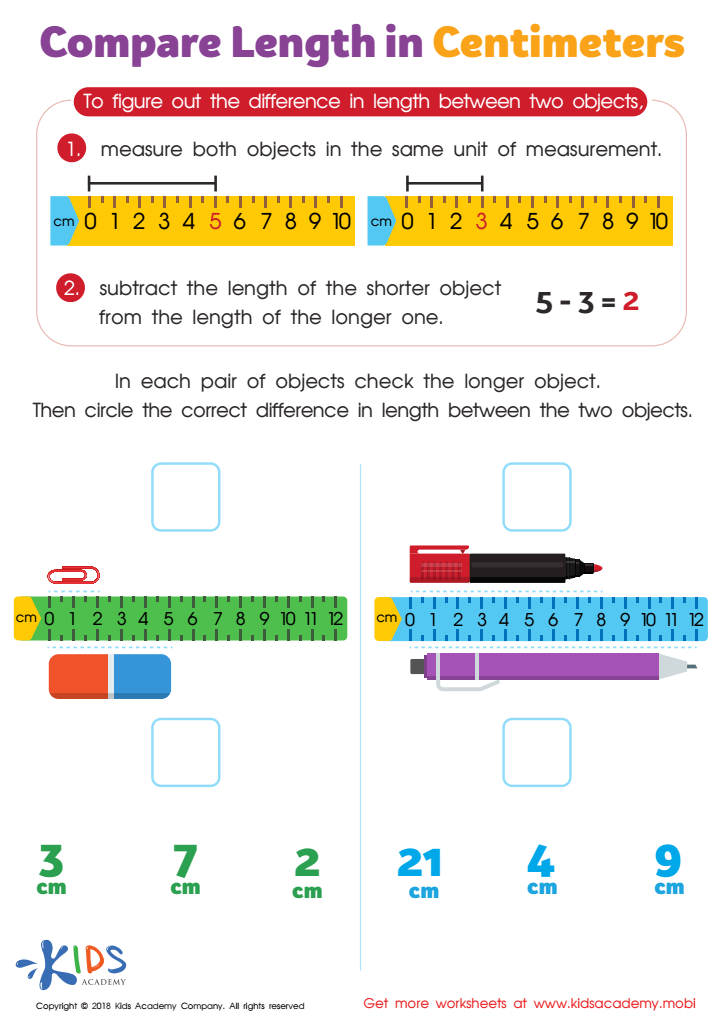
Compare Length in Centimeters Worksheet


Interpreting data for children ages 3-9 is crucial for both parents and teachers because it informs developmental milestones, learning progress, and intervention strategies effectively. At this stage, children undergo significant cognitive, emotional, and social growth. By analyzing data related to their academic performance and behavioral patterns, educators and parents can identify strengths and weaknesses, enabling tailored support and resources to enhance learning experiences.
Understanding data also aids in recognizing trends in children’s comprehension and skill acquisition, whether it’s in literacy, numeracy, or social interactions. This ensures that instruction is aligned with each child's individual learning needs and abilities. Furthermore, tracking progress through data interpretation allows both parents and teachers to celebrate successes and strategize improvements when challenges arise.
Additionally, collaborating on data interpretation fosters a stronger partnership between home and school, creating a unified approach to a child’s education. Jointly interpreting data can encourage effective communication about a child’s needs and can empower parents to take an active role in their child's learning journey. Ultimately, a comprehensive understanding of data helps cultivate an environment where children can thrive academically and emotionally.