Interpreting data Grade 3 Math Worksheets
3 filtered results
Difficulty Level
Grade
Age
-
From - To
Subject
Activity
Standards
Discover fun and engaging "Interpreting Data Grade 3 Math Worksheets" at Kids Academy! Designed specifically for third graders, these worksheets help students sharpen their analytical skills by interpreting various types of data, including bar graphs, pictographs, and line plots. With an array of colorful and interactive exercises, young learners can practice critical reading of data, comparing and contrasting information, and drawing insightful conclusions. Each worksheet is crafted to align with key math standards, ensuring your child builds a solid foundation in data interpretation. Boost your child's math confidence and capabilities with these essential resources!
Favorites
With answer key
Interactive
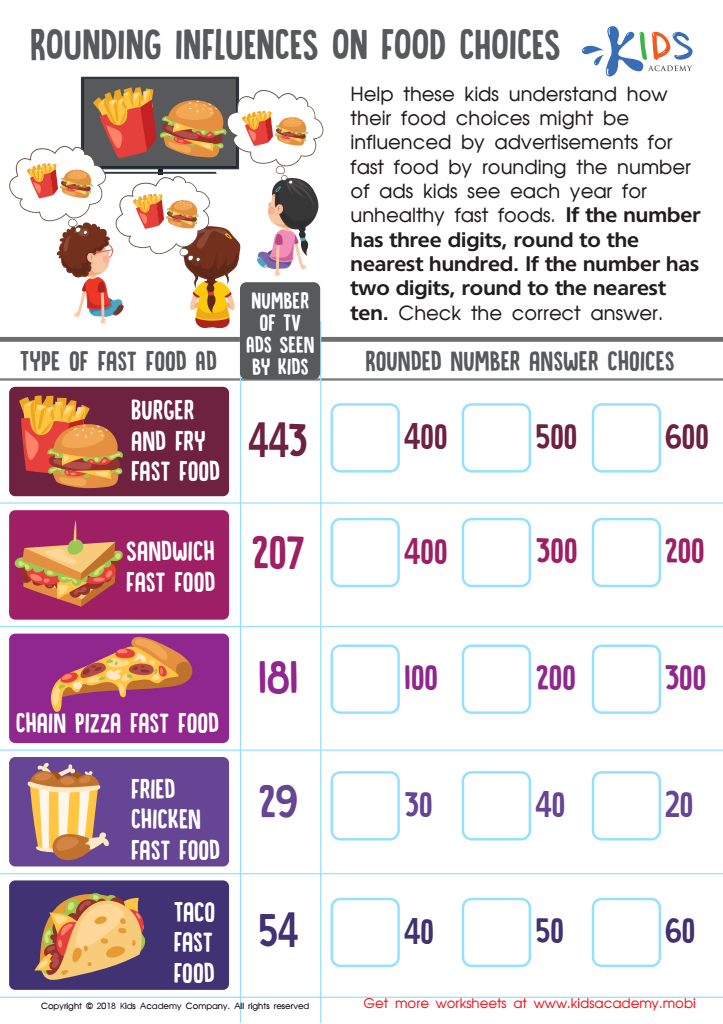
Rounding Influences Food Choices Worksheet
Kids find math more enjoyable when it reflects real-life scenarios. This free worksheet combines math and health! Kids view data on the number of ads they're exposed to in a year and must round the numbers to the nearest ten or hundred. Solve and check the correct answers to finish.
Rounding Influences Food Choices Worksheet
Worksheet

Interpret Line Plot Worksheet
Kids can learn to read graphs and analyze data easily with line plots. A fun zoo animal worksheet motivates kids to answer questions by reading the line plot and finding out how many animals a local zoo has.
Interpret Line Plot Worksheet
Worksheet

Leaf Bar Graph Worksheet
You can help your kids make learning easier and more enjoyable. While their teachers provide lessons and homework, you can take their education further. This worksheet can assist them in mastering bar charts. Count the leaves, then trace the correct line for each bar to complete the graph.
Leaf Bar Graph Worksheet
Worksheet
Join Kids Academy for Free
Who is primarily going to use this learning content?


Interpreting data in Grade 3 math is fundamental for developing critical thinking and analytical skills in young learners. When parents and teachers prioritize this aspect of education, they help children build a solid foundation for future learning and real-world problem-solving.
Firstly, interpreting data teaches children how to make sense of information they encounter in daily life. Whether it's reading a weather chart, understanding sports scores, or evaluating simple surveys, data interpretation enhances their ability to grasp and use numerical information effectively. This skill is increasingly essential in a world where data drives many decisions.
Secondly, engaging with data helps students improve their math skills, such as counting, addition, subtraction, and introduction to fractions and percentages. These concepts become more meaningful and grounded when students see how they apply to the data they analyze.
Additionally, developing data interpretation skills encourages logical thinking and promotes curiosity and inquiry. Children learn to ask relevant questions, seek answers, and present their findings. This process boosts their confidence and prepares them for advanced studies across subjects, including science, social studies, and economics.
In short, focusing on interpreting data in Grade 3 equips students with vital skills for academic success and everyday life, fostering a generation of informed, capable, and analytical thinkers.